Invariant mass distribution of reconstructed photon pairs $M_{\gamma\gamma}$ for the \pai and \e mesons measured with PCM, (a) and (b), and EMCal, (c) and (d), in the centrality class 0--10\%. The black histograms show the signal before background subtraction while the red bullets show the signal after subtraction. The estimated background is indicated by the grey dashed lines. The blue lines are the fit to the invariant mass peak after the combinatorial and residual background subtraction (see text for description). | 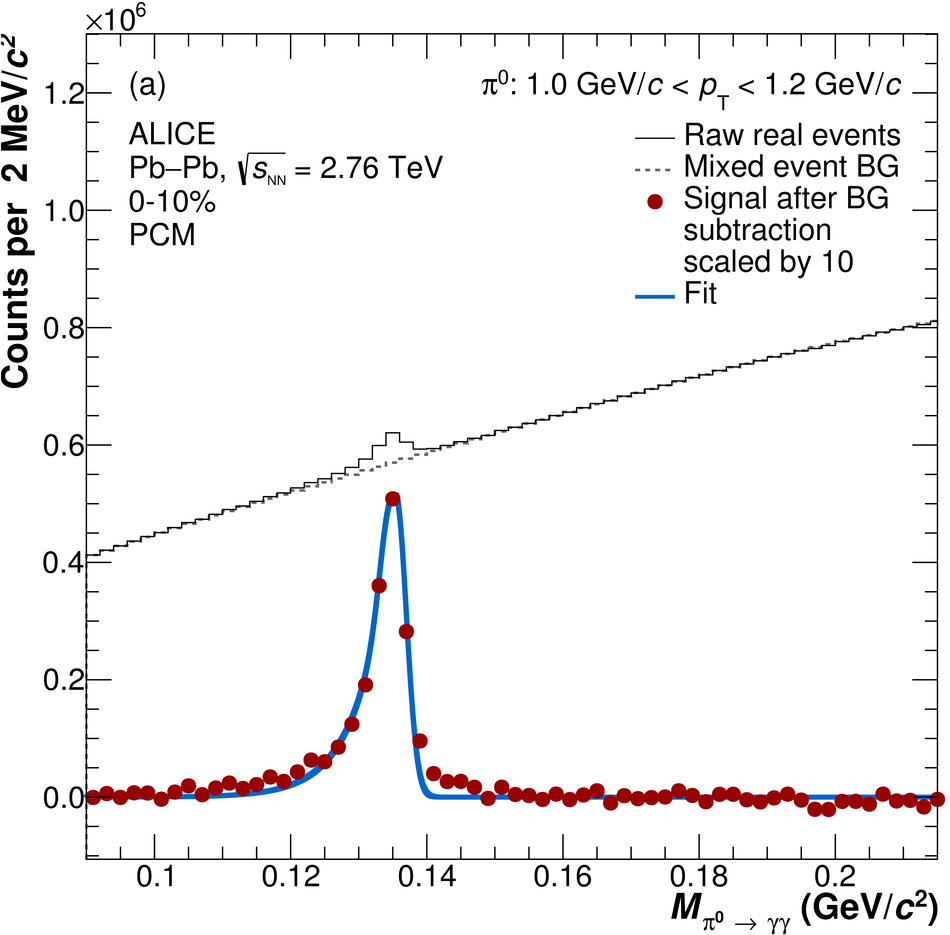 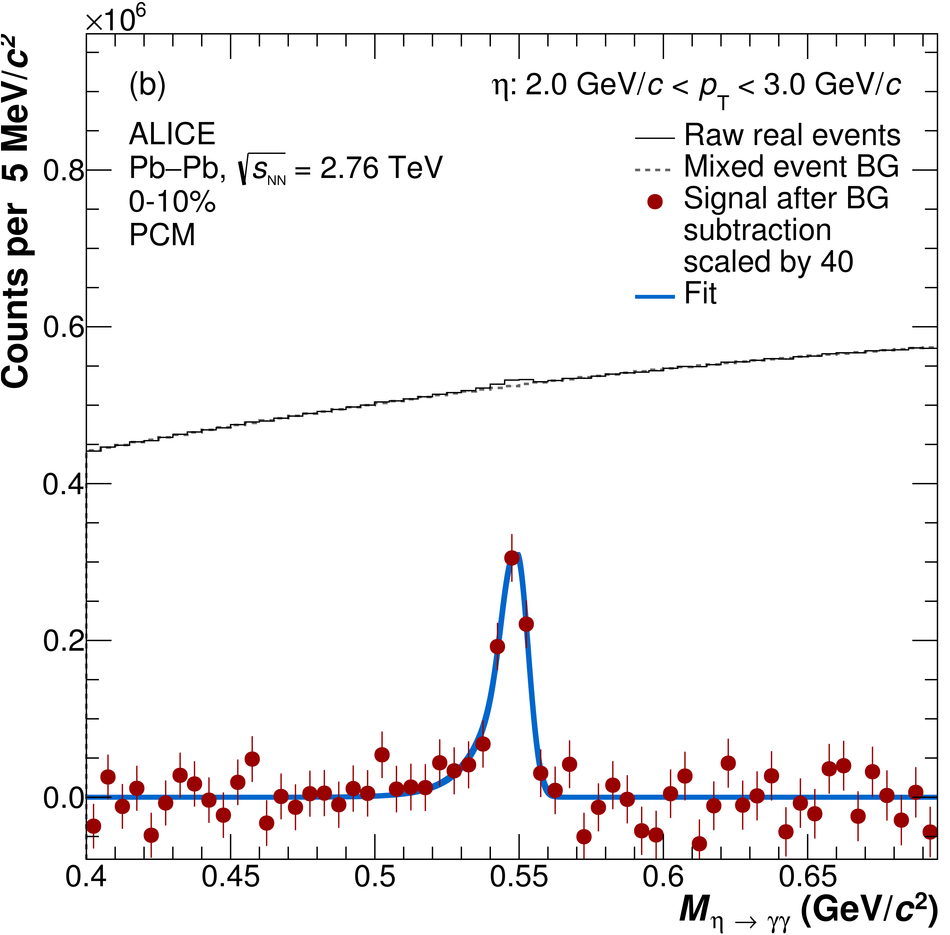 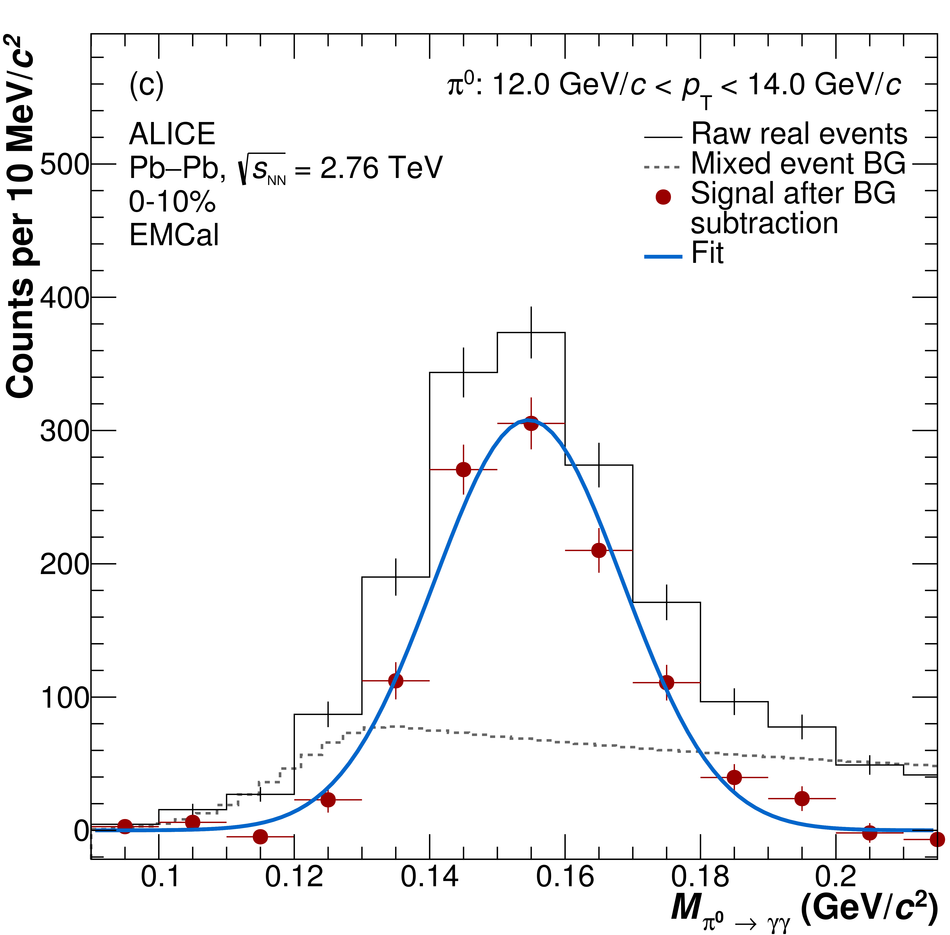 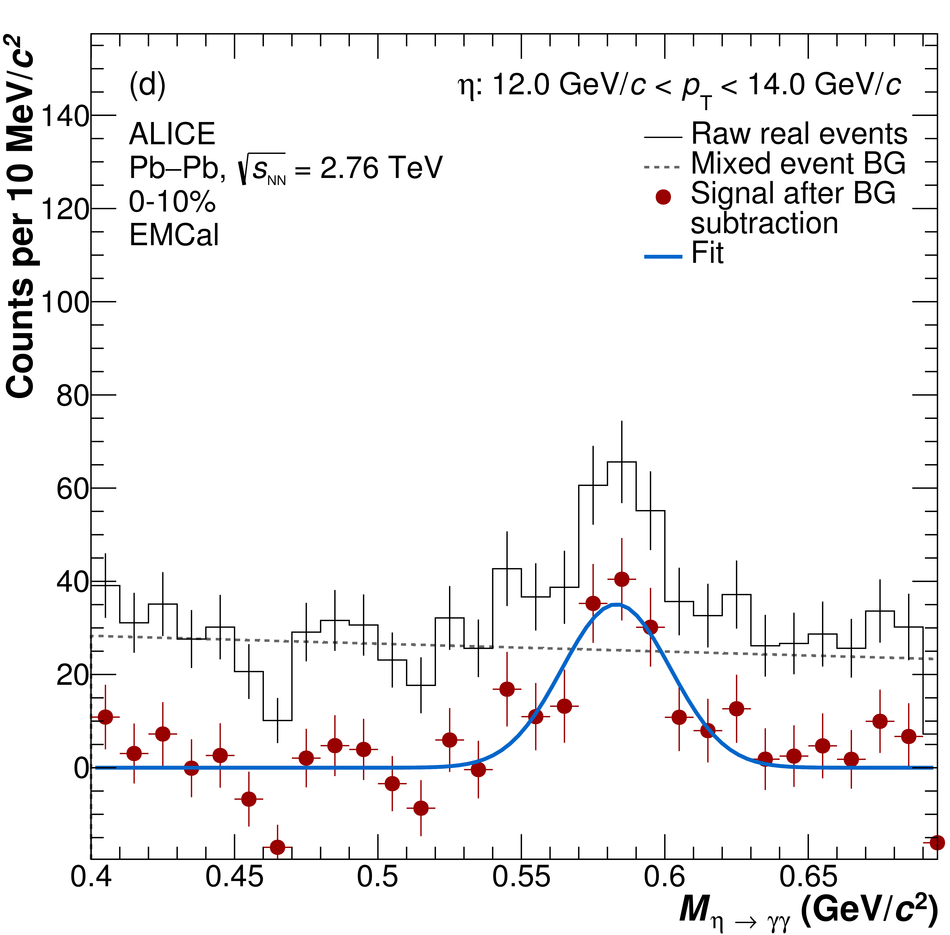 |