Comparison of different theoretical model calculations to the \pai (left) and \e (right) nuclear modification factors \RpA measured in NSD \pPb collisions at -1.365 $< y_{\mathrm{cms}}< $ 0.435 at \spPb. The grey band shows a pQCD calculation at NLO using the EPPS16 nPDF , the CT14 PDF and the DSS14 FF including systematic uncertainties. Color Glass Condensate predictions using the {\ensuremath{k_{\mbox{\tiny T}}}\xspace} factorization method are also shown. NLO calculations using nCTEQ nPDF , and DSS14 FF (\pai) or AESSS FF (\e) are also shown. | 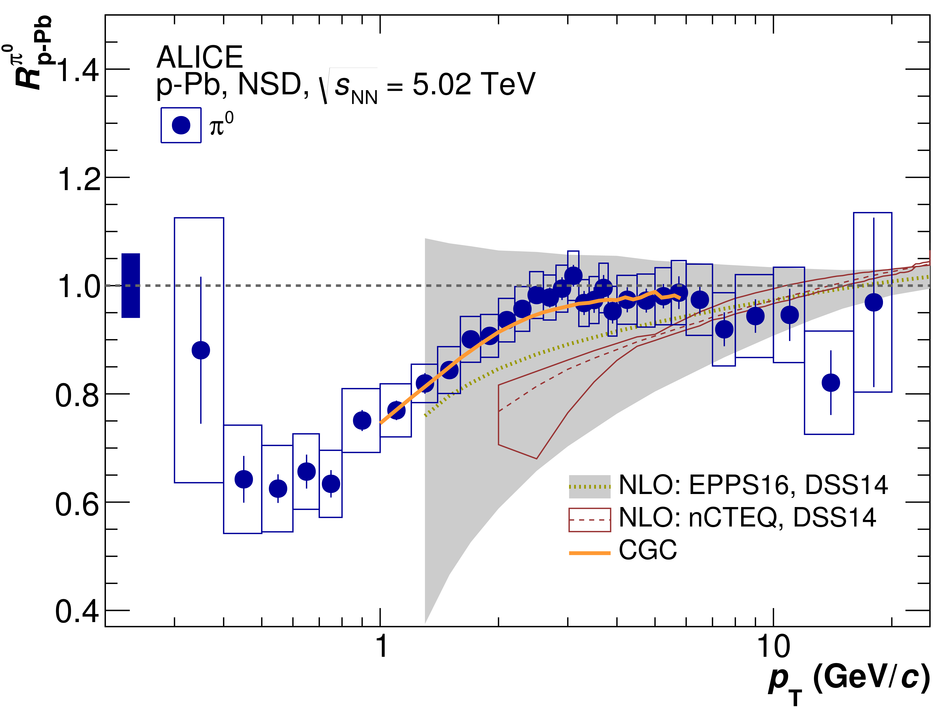 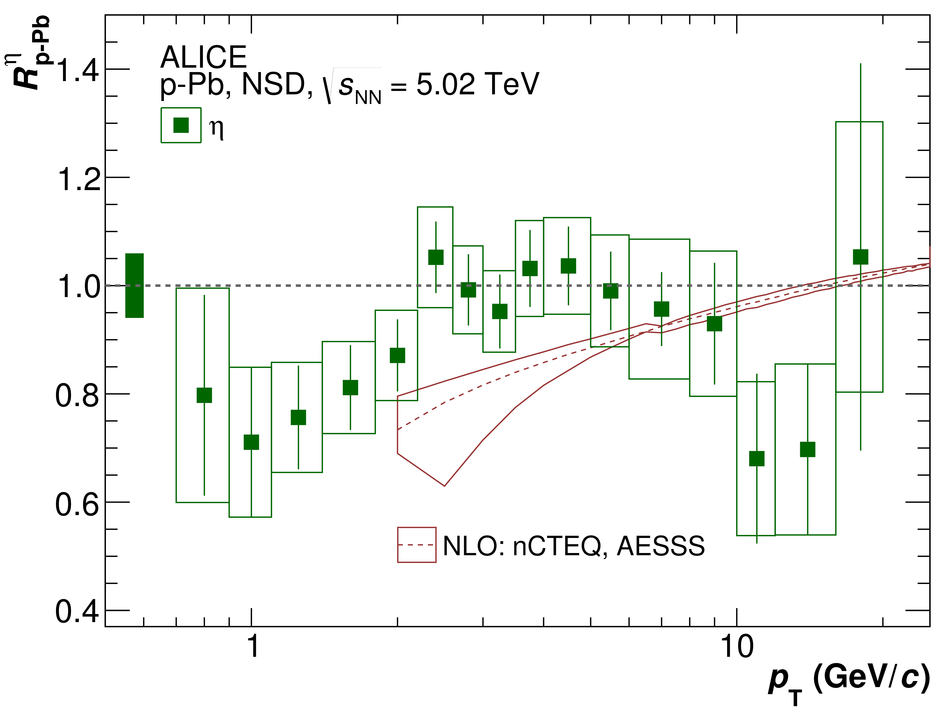 |