Comparison of different theoretical calculations to the \e /\pai ratio measured in NSD \pPb collisions at -1.365 $< y_{\mathrm{cms}}< $ 0.435 at \spPb from \hyperref[fig:EtaPi0RatioALICE]{Fig. \ref*{fig:EtaPi0RatioALICE}} Theoretical calculations are shown for the EPOS3 model with statistical errors shown as a band, hydrodynamic framework (VISHNU) using the iEBE-VISHNU code , DPMJET model and HIJING model . | 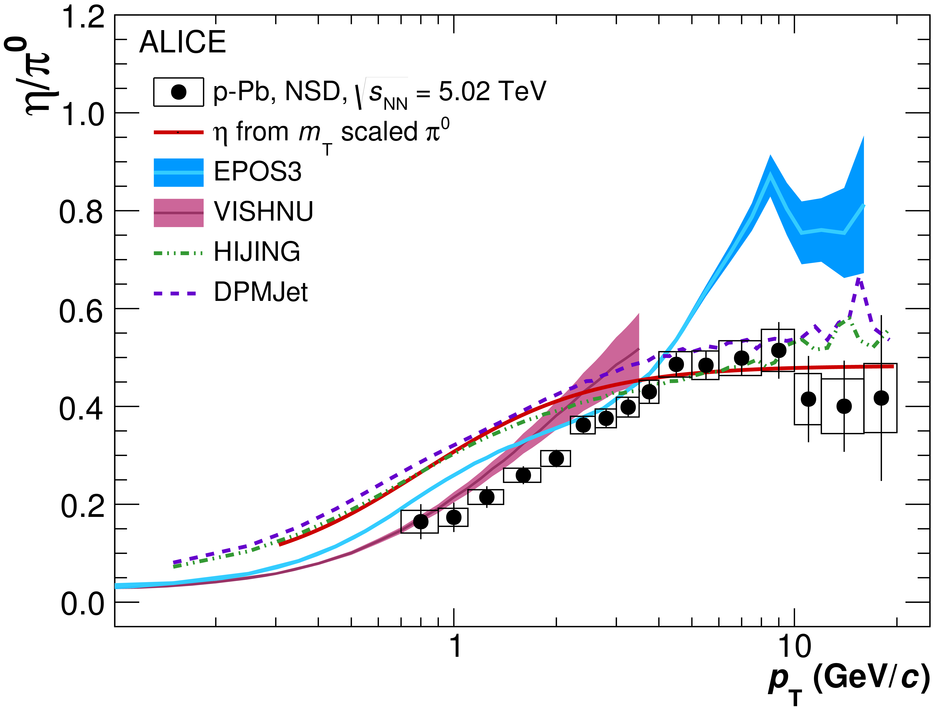 |