Left: Invariant differential \pai and \e yields produced in NSD \pPb collisions at -1.365 $< y_{\mathrm{cms}}< $ 0.435 at \spPb. The statistical uncertainties are represented as vertical error bars whereas the systematic uncertainties are shown as boxes. In addition, Tsallis fits to the measured yields are shown. The TCM fit to the $\langle \TpPb \rangle$ scaled \pai and \e pp reference spectra (see \hyperref[sec:RpA]{Sect. \ref*{sec:RpA}} for details) is shown. Right: Ratios of the measured data to their corresponding Tsallis fits. | 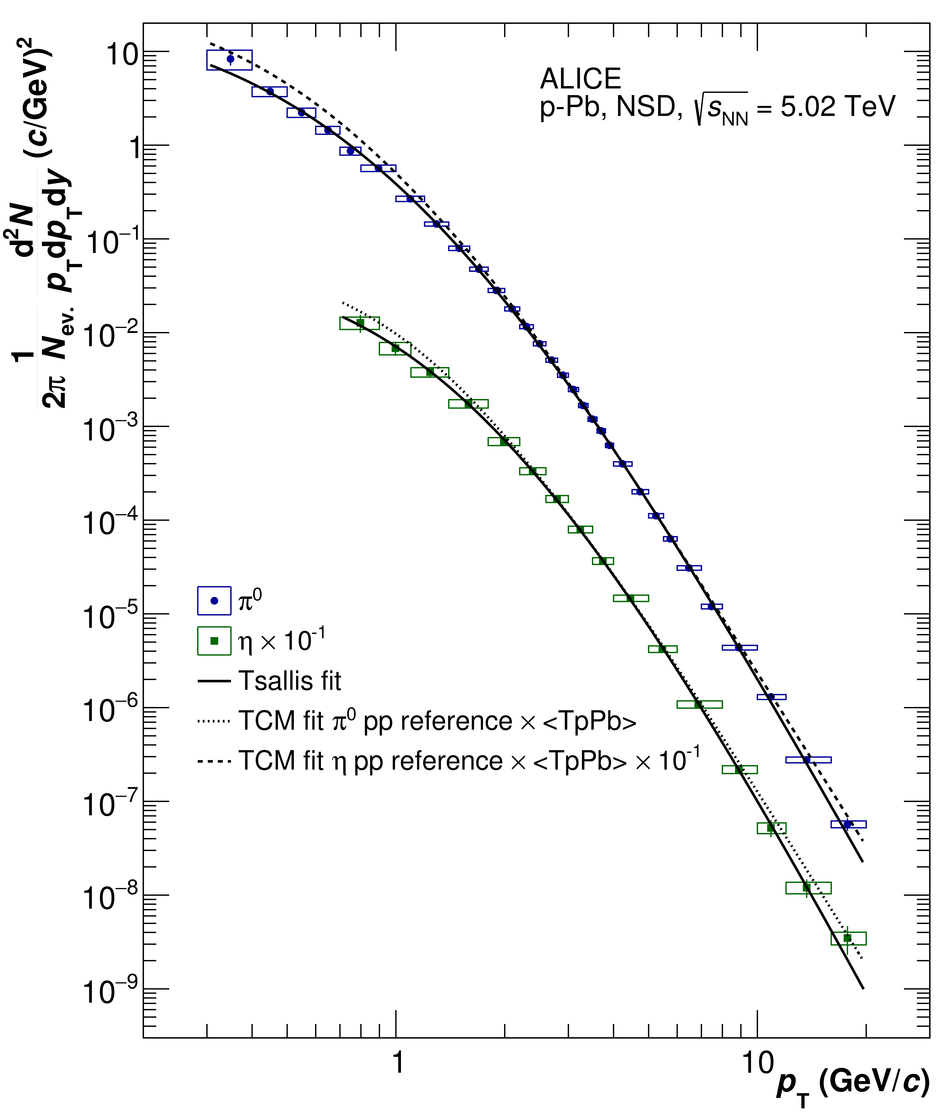 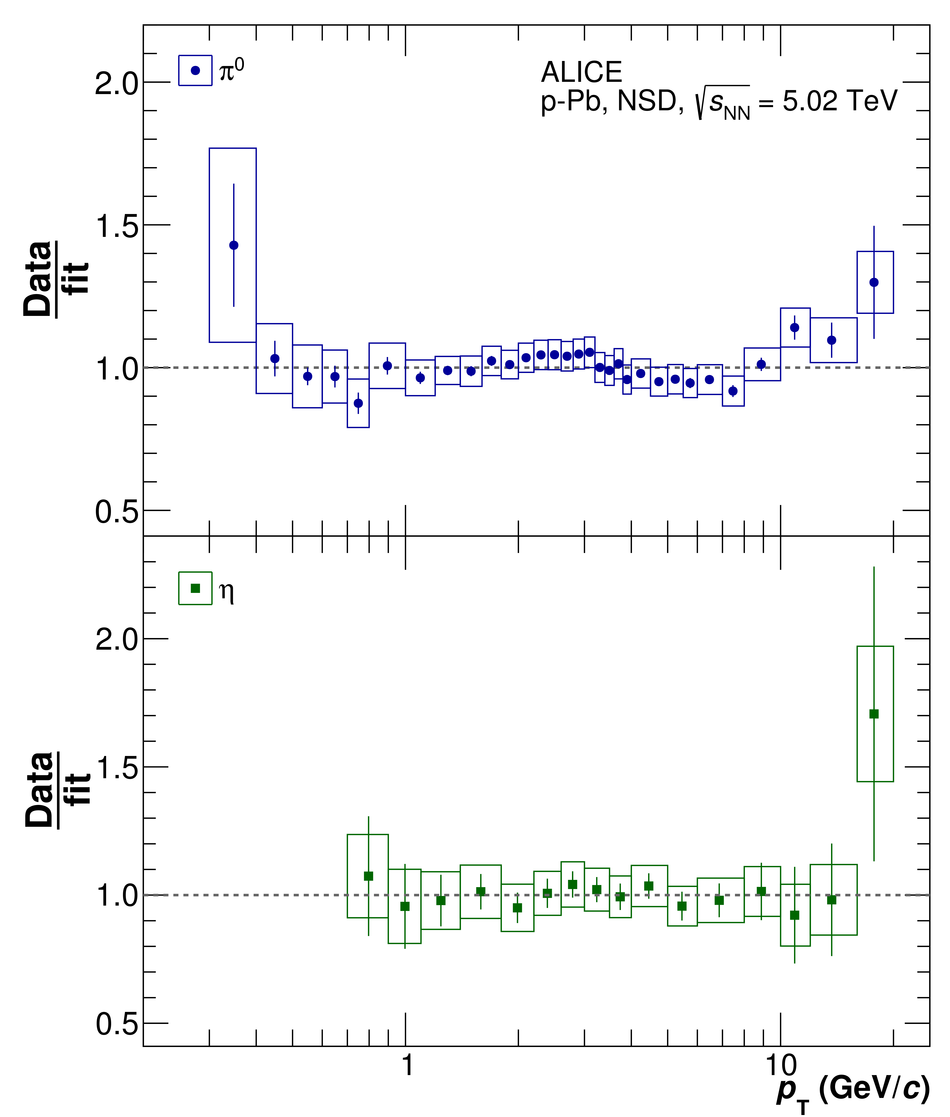 |