Corrected \Drecoil\ distributions measured for \pPb\ collisions at $\sqrtsNN = 5.02$\,TeV, for the MB and EA-selected populations. The acceptance for TT and recoil jets in the CM frame are denoted \ystarTT\ and \ystarjet, respectively. Left panels: $\rr=0.2$; right panels: $\rr=0.4$. Also shown are \Drecoil\ distributions for \pp\ collisions at $\sqrts = 5.02$ TeV simulated by PYTHIA 6 Tune Perugia 11 and PYTHIA 8 Tune 4C. The solid line in the upper panels is the fit of an exponential function to the \pPb\ distribution, with fit parameters as specified. Lower panels: ratio of \pPb\ MB and \pp\distributions to the fit function. | 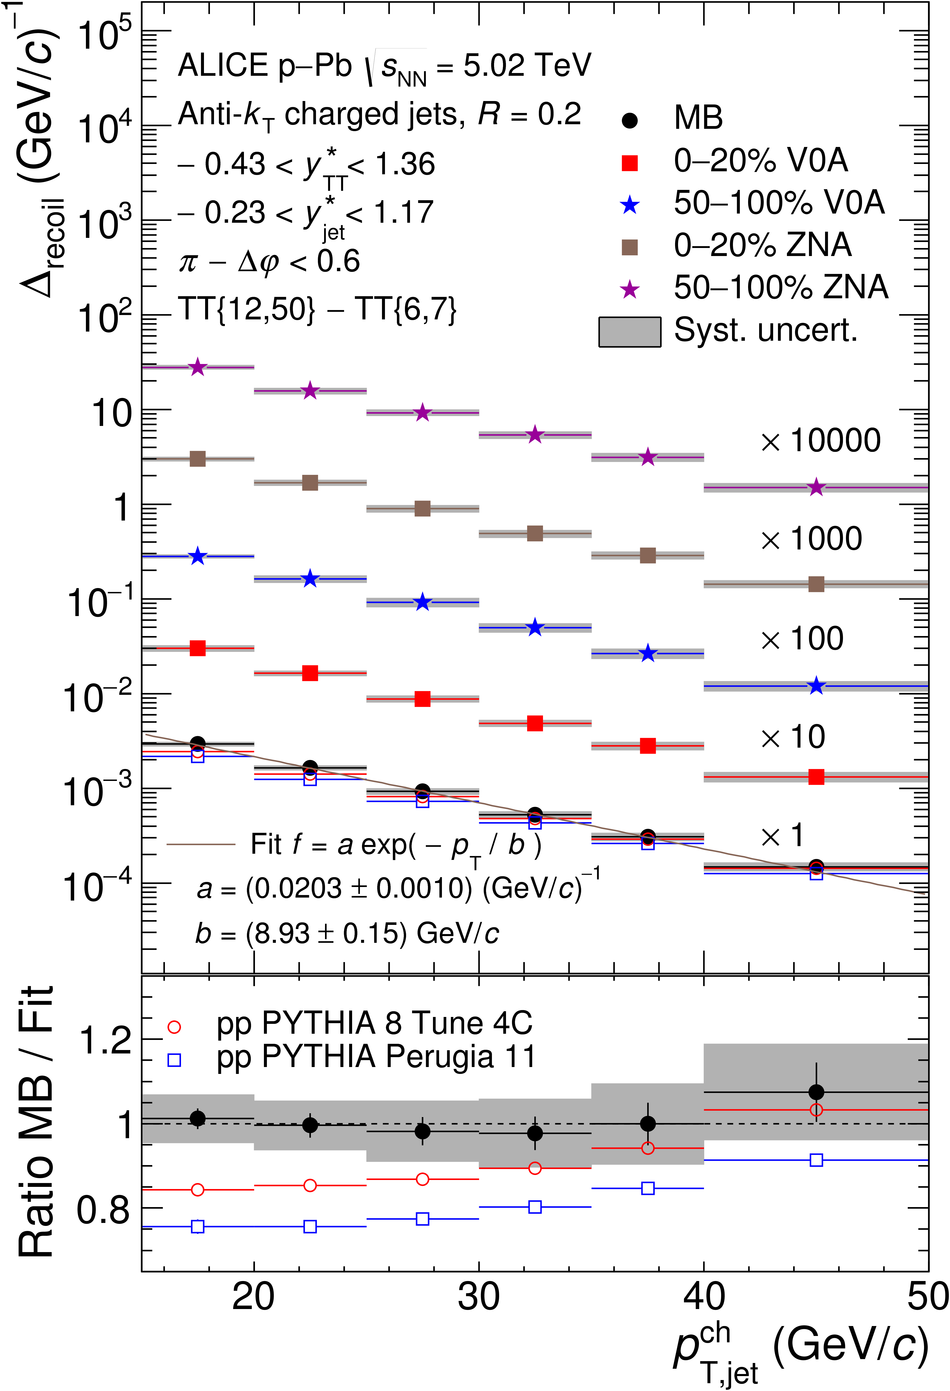 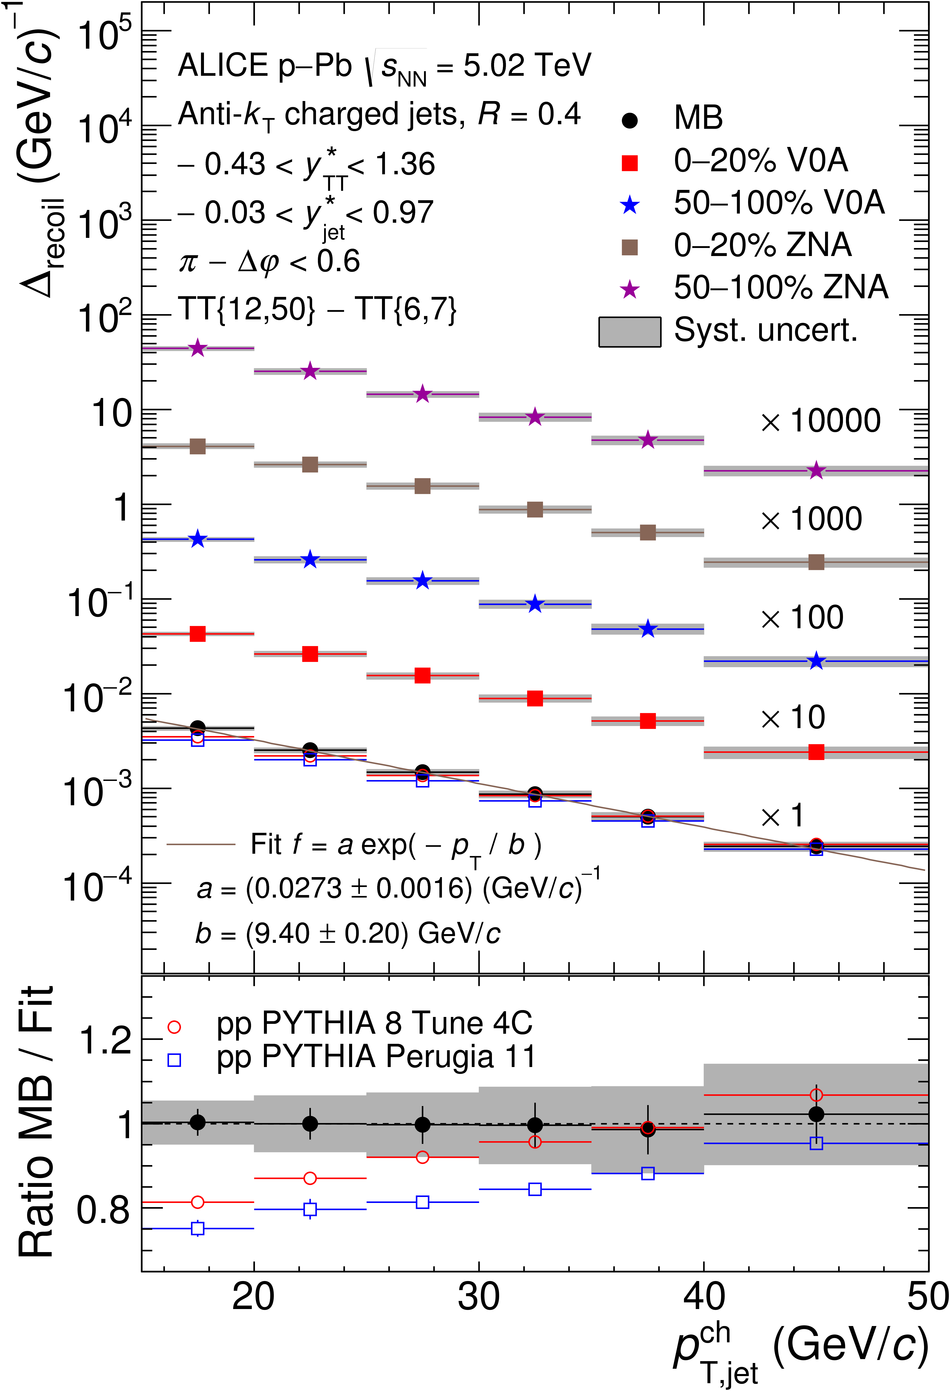 |