Two-particle correlations in high-energy collision experiments enable the extraction of particle source radii by using the Bose-Einstein enhancement of pion production at low relative momentum $q\propto 1/R$. It was previously observed that in $\rm{p}\rm{p}$ collisions at $\sqrt{s}=7$ TeV the average pair transverse momentum $k_{\rm T}$ range of such analyses is limited due to large background correlations which were attributed to mini-jet phenomena. To investigate this further, an event-shape dependent analysis of Bose-Einstein correlations for pion pairs is performed in this work. By categorizing the events by their transverse sphericity $S_{\rm T}$ into spherical $(S_\textrm{T}>0.7)$ and jet-like $(S_\textrm{T}<~0.3)$ events a method was developed that allows for the determination of source radii for much larger values of $k_{\rm T}$ for the first time. Spherical events demonstrate little or no background correlations while jet-like events are dominated by them. This observation agrees with the hypothesis of a mini-jet origin of the non-femtoscopic background correlations and gives new insight into the physics interpretation of the $k_{\rm T}$ dependence of the radii. The emission source size in spherical events shows a substantially diminished $k_{\rm T}$ dependence, while jet-like events show indications of a negative trend with respect to $k_{\rm T}$ in the highest multiplicity events. Regarding the emission source shape, the correlation functions for both event sphericity classes show good agreement with an exponential shape, rather than a Gaussian one.
JHEP09 (2019) 108
HEP Data
e-Print: arXiv:1901.05518 | PDF | inSPIRE
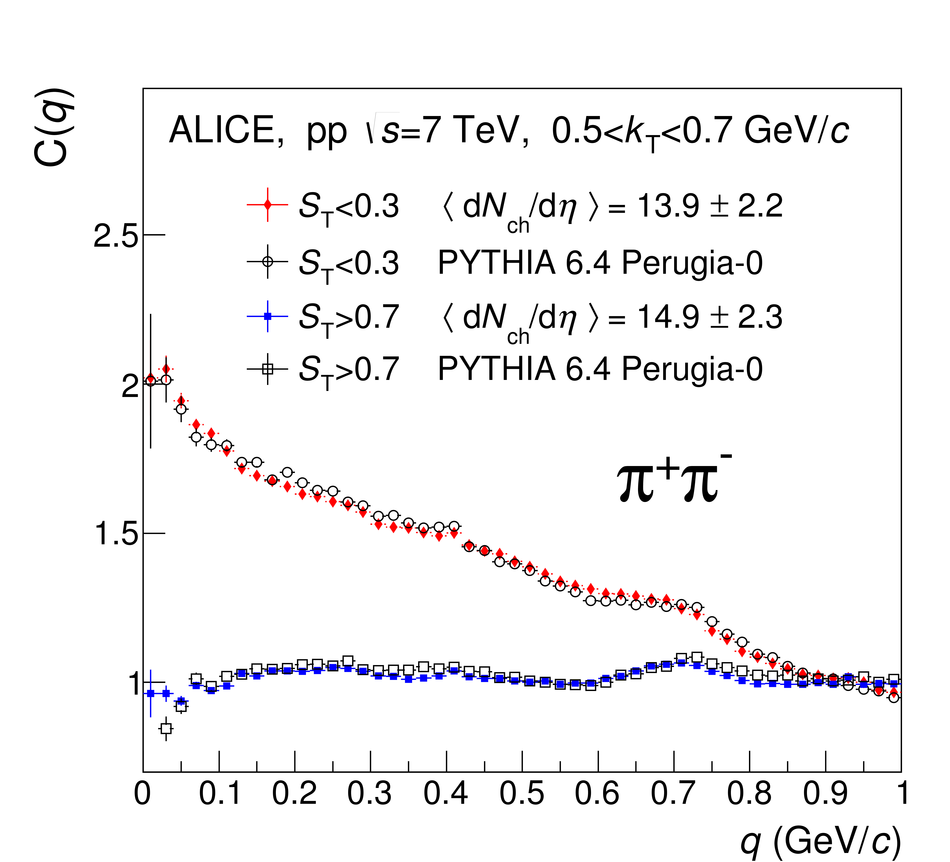

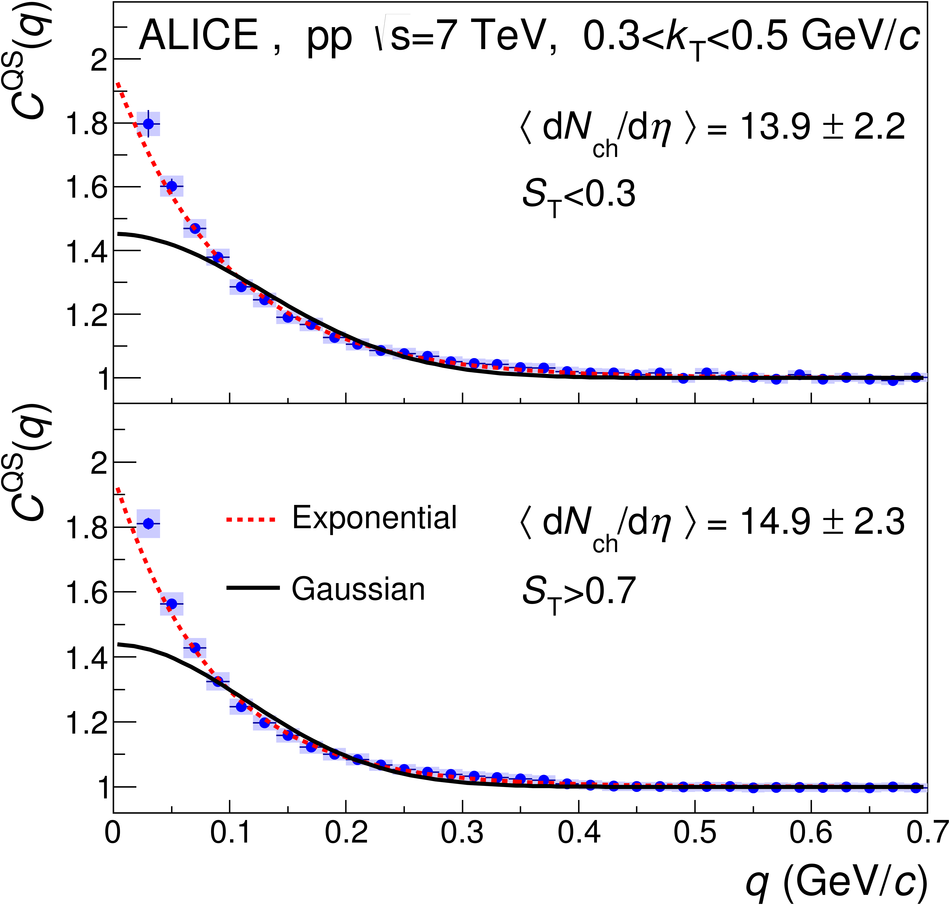
Figure 4
Measured 1D source radii as a function of pair \kT for spherical and jet-like events in pp collisions at $\sqrt{s}=7$ TeV. Points are shifted horizontally for clarity. The vertical error bars represent the statistical uncertainties of the measurement, while the shaded and open boxes represent the uncorrelated and correlated systematic uncertainties, respectively. | 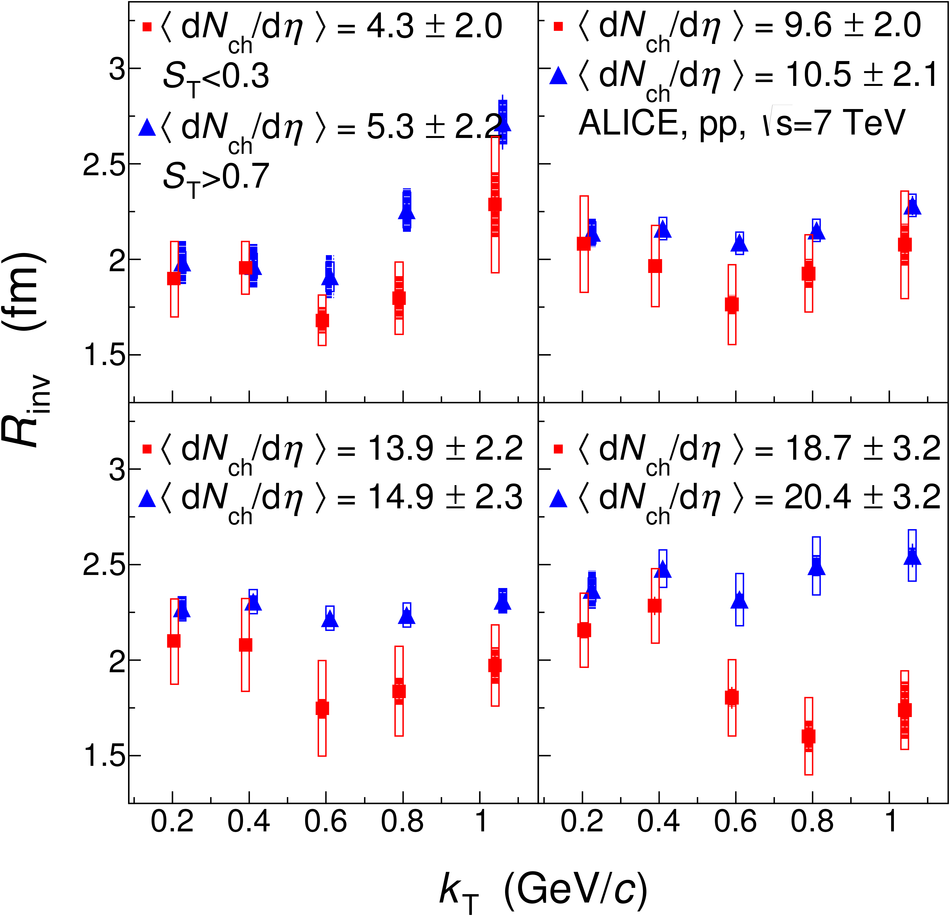 |