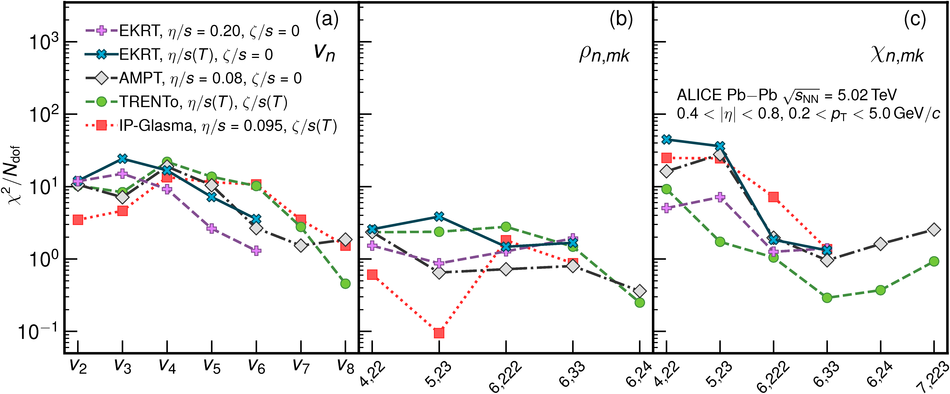
Anisotropic flow coefficients, $v_n$, non-linear flow mode coefficients, $\chi_{n,mk}$, and correlations among different symmetry planes, $\rho_{n,mk}$ are measured in Pb-Pb collisions at $\sqrt{s_\rm{NN}}=5.02$ TeV. Results obtained with multi-particle correlations are reported for the transverse momentum interval $0.2<~p_\rm{T}<~5.0$ GeV/$c$ within the pseudorapidity interval $0.4<~|\eta|<~0.8$ as a function of collision centrality. The $v_n$ coefficients and $\chi_{n,mk}$ and $\rho_{n,mk}$ are presented up to the ninth and seventh harmonic order, respectively. Calculations suggest that the correlations measured in different symmetry planes and the non-linear flow mode coefficients are dependent on the shear and bulk viscosity to entropy ratios of the medium created in heavy-ion collisions. The comparison between these measurements and those at lower energies and calculations from hydrodynamic models places strong constraints on the initial conditions and transport properties of the system.
JHEP05 (2020) 085
HEP Data
e-Print: arXiv:2002.00633 | PDF | inSPIRE
CERN-EP-2019-287
Figure 1
The five different parameterizations of $\eta/s$ and $\zeta/s$ used for the different hydrodynamic model calculations are shown in the left and right panel. Note that the functional form of $\zeta/s(T)$ is the same for param3 and param4 and taken from Eq. 5 in motivated by Refs. . For the parameters with \trento{} initial condition, the ones based on identified yields are taken from Table 4 in . The $\zeta/s$ normalization factor used with IP-Glasma (\trento) initial conditions is 0.9 (1.25). The models with $\zeta/s=0$ are not shown on the right. | 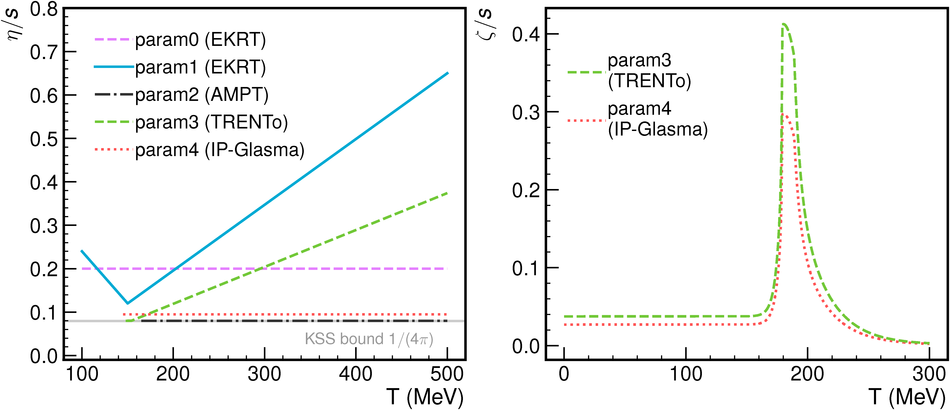 |
Figure 2
Flow harmonics up to the ninth order as a function of centrality, along with five different hydrodynamic calculations shown as color bands, each representing different configurations. For the black markers representing the measured data points, the sytematic uncertainty is indicated by the gray patches around the markers. The bands indicate the extent of the uncertainty of the corresponding calculation. On the bottom part of each panel, the ratios between model calculations and the data are shown with symbols. Ratios with uncertainties larger than 1 are not shown in the ratio panel. For some panels, the points are scaled by an indicated factor for better visibility across the panels. | 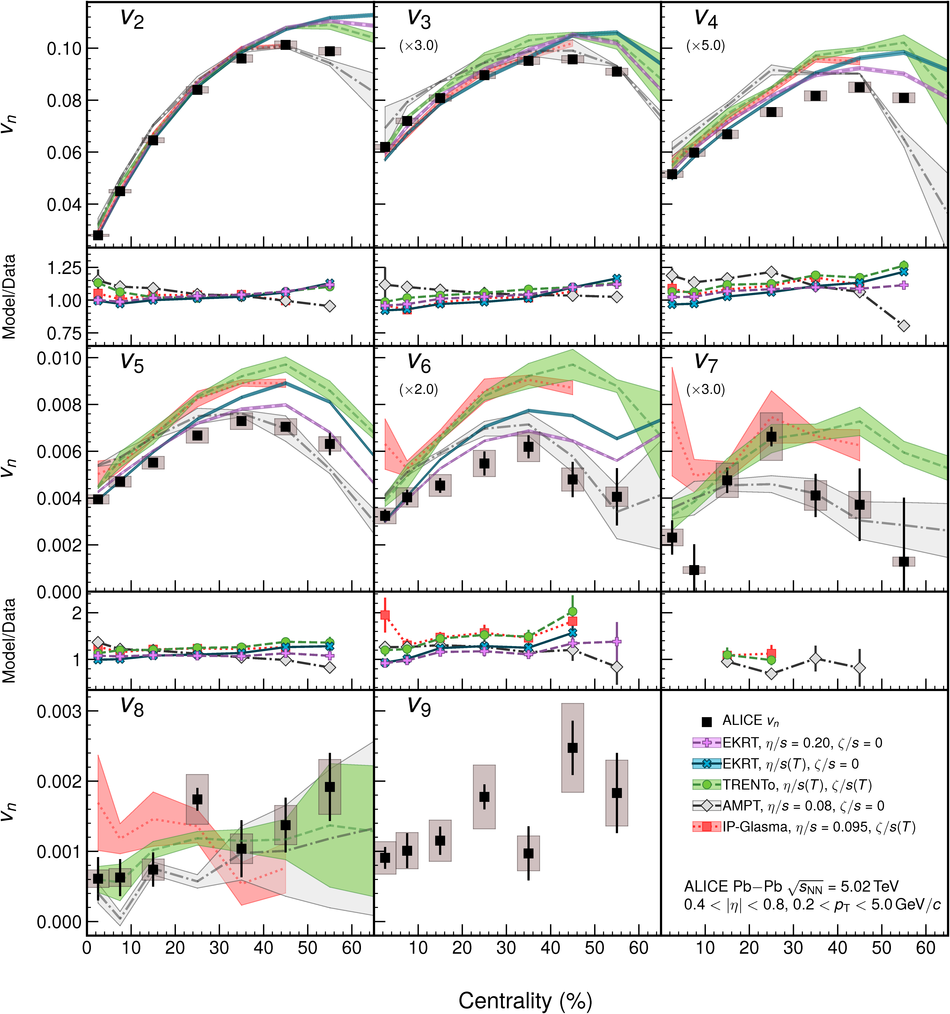 |
Figure 4
Linear and non-linear flow modes as a function of centrality. The total contribution measured in Pb--Pb collisions at $\sqrt{s_\mathrm{NN}}=5.02\,\mathrm{TeV}$ is shown as black squares. Various non-linear contributions are presented in different red and blue colors, while the linear part, extracted from the aforementioned contributions, is shown as a red band. For panel (b), the data points are scaled by 2.5 for better visibility across the panels. | 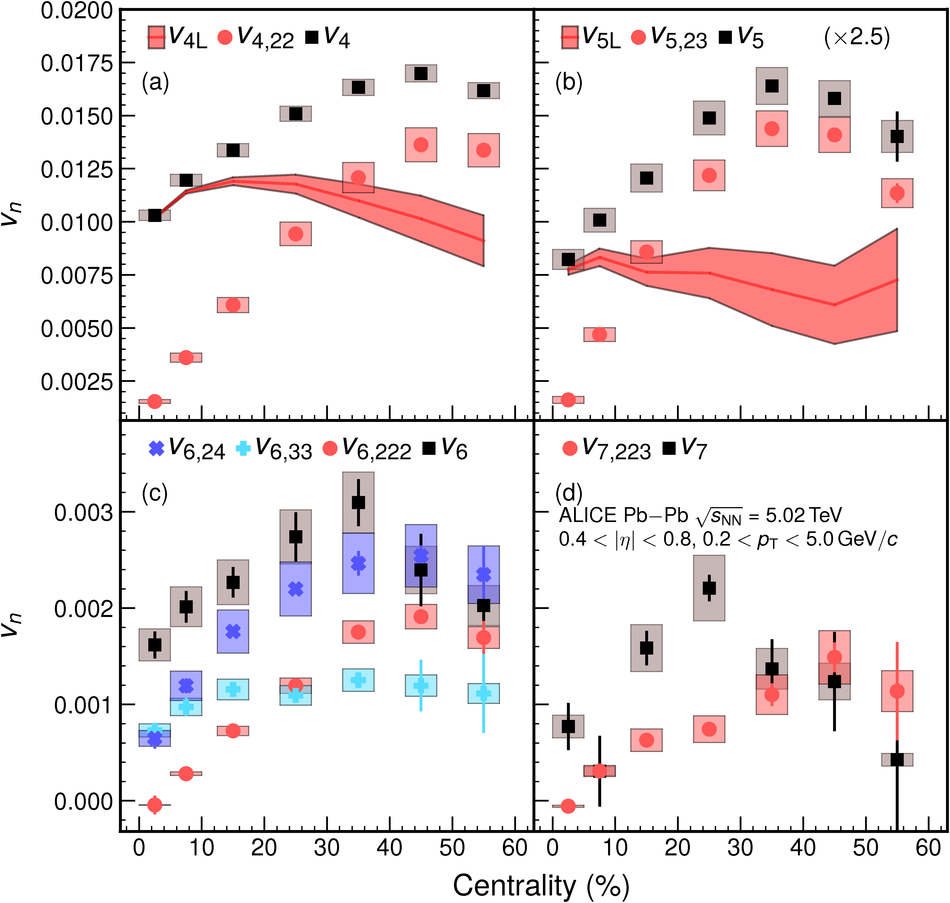 |
Figure 5
Symmetry-plane correlations as a function of centrality in Pb--Pb collisions at $\sqrt{s_\mathrm{NN}}=5.02\,\mathrm{TeV}$ (black markers) compared with those in Pb--Pb collisions at $\sqrt{s_\mathrm{NN}}=2.76\,\mathrm{TeV}$ , along with five different hydrodynamic calculations shown as color bands. On the bottom part of each panel, the ratios between model calculations and the data are shown. For some panels, the data points are scaled by an indicated factor for better visibility. | 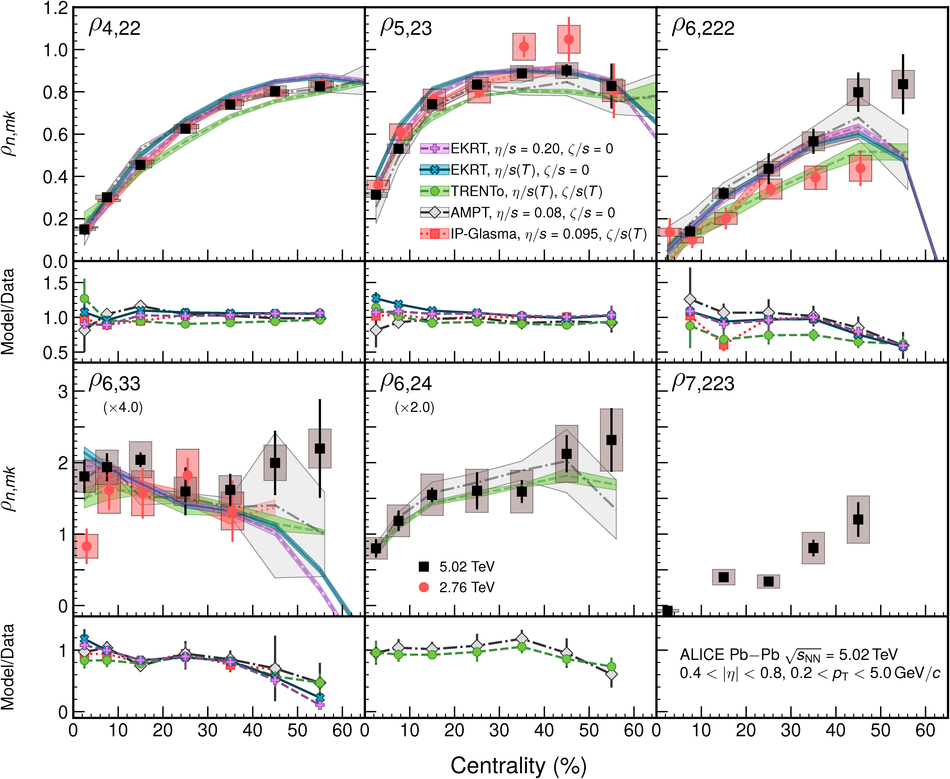 |
Figure 6
Non-linear mode coefficients as a function of centrality in Pb--Pb collisions at $\sqrt{s_\mathrm{NN}}=5.02\,\mathrm{TeV}$ (black markers) compared with those from $\sqrt{s_\mathrm{NN}}=2.76\,\mathrm{TeV}$ (red markers) , along with five different hydrodynamic calculations shown as color bands. On the bottom part of each panel, the ratios between model calculations and the data are shown. For some panels, the points are scaled by an indicated factor for better visibility across the panels. | 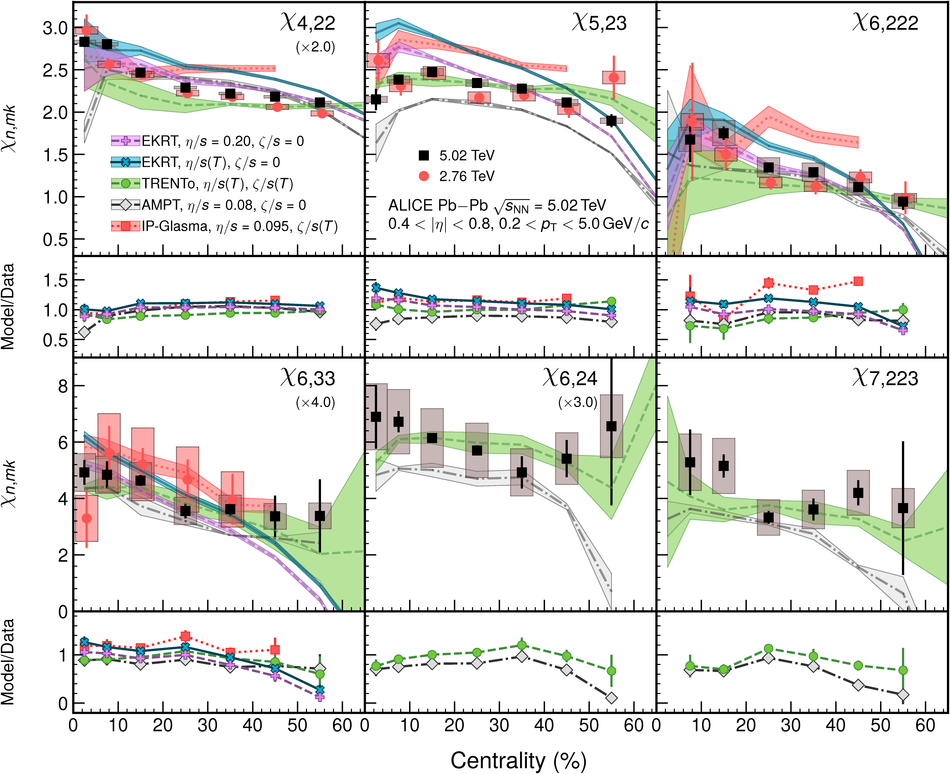 |