(left) Differential yield per inelastic pp collision for the neutral pion measurement at $\sqrt{s}=8$ TeV with logarithmic x-axis and (right) showing only the low momentum region $< 2$ \ensuremath{\mbox{GeV}/c} with linear scale on x-axis. The different fits as described in the previous paragraph are shown which are used to determine the integrated yields and mean transverse momenta. | 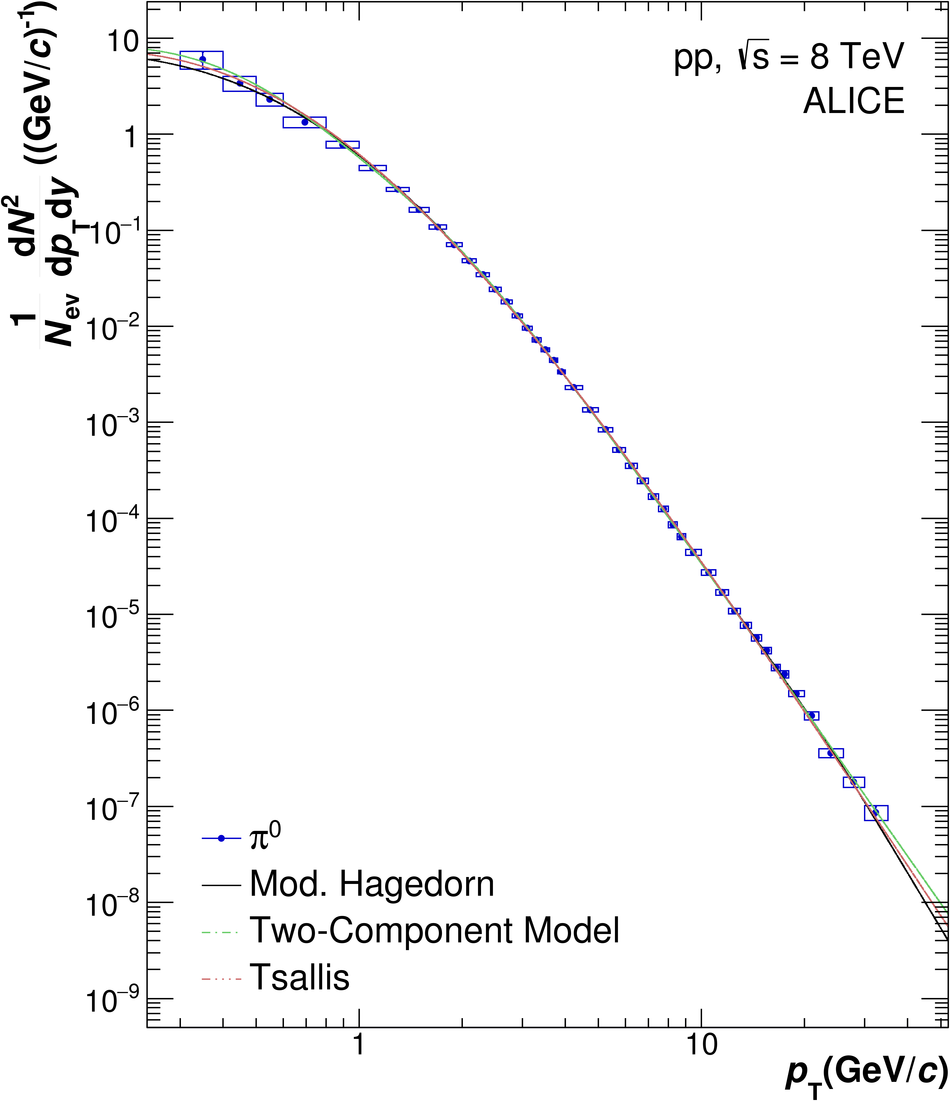 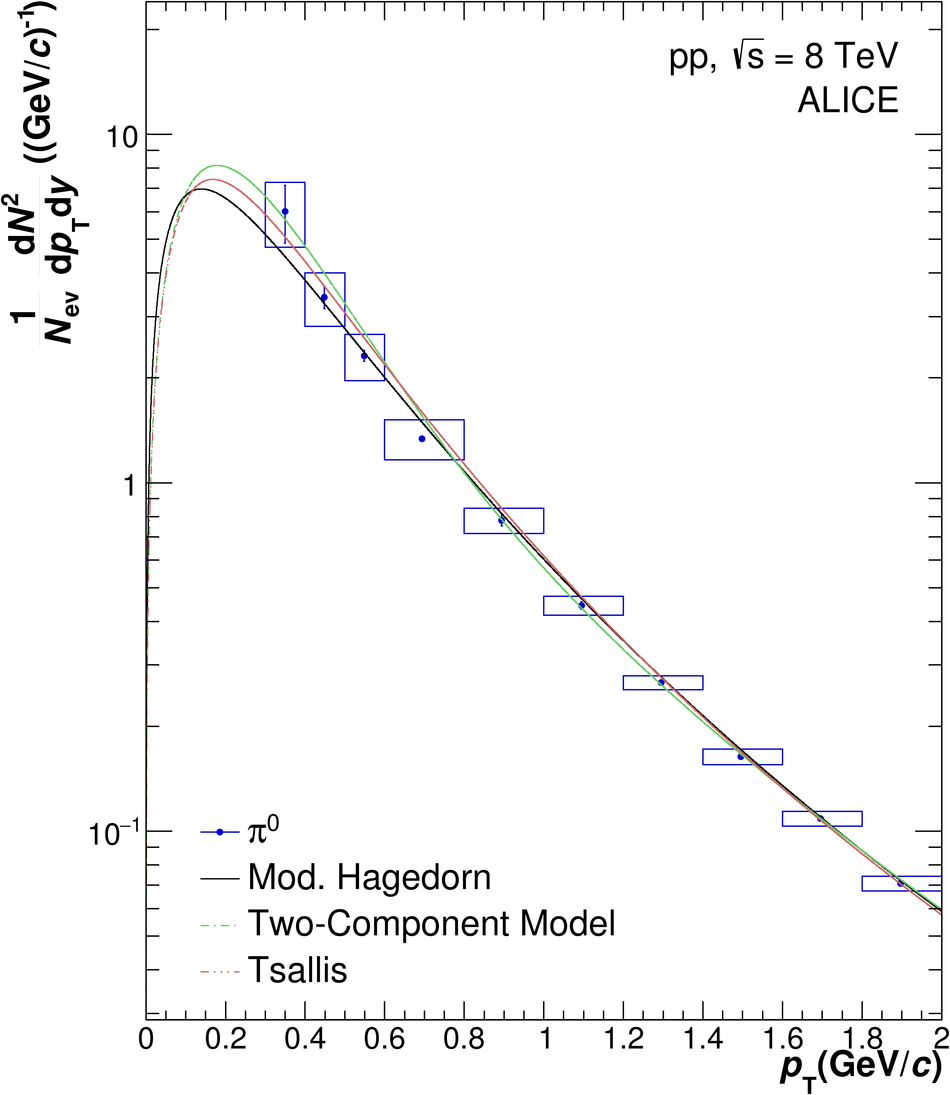 |