Example invariant mass spectra in selected $p_{\rm T}$ slices for PCM (top left), PHOS (top right), EMC (bottom left) and PCM-EMC (bottom right) in the $\pi^{0}$ mass region The black histograms show raw invariant mass distributions before any background subtraction The grey points show mixed-event and residual correlated background contributions, which have been subtracted from raw real events to obtain the signal displayed with red data points The blue curves represent fits to the background-subtracted invariant mass spectra Additional examples of invariant mass distributions for the different methods are given in Ref. . | 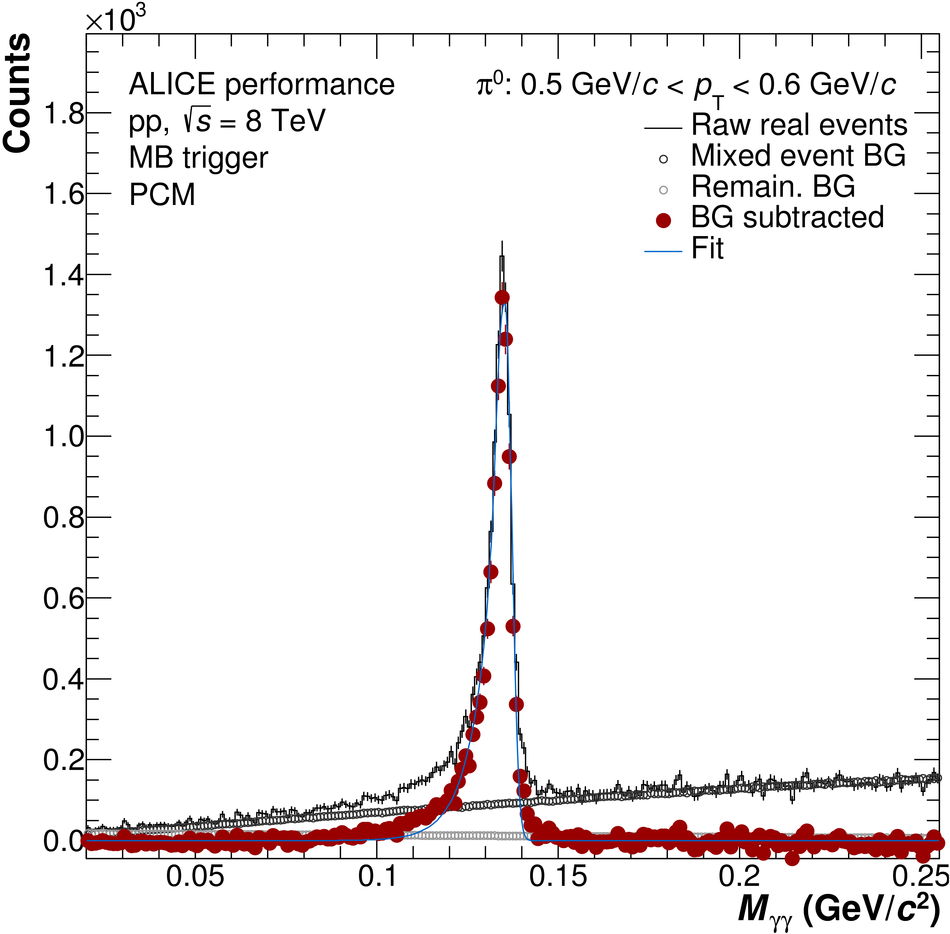 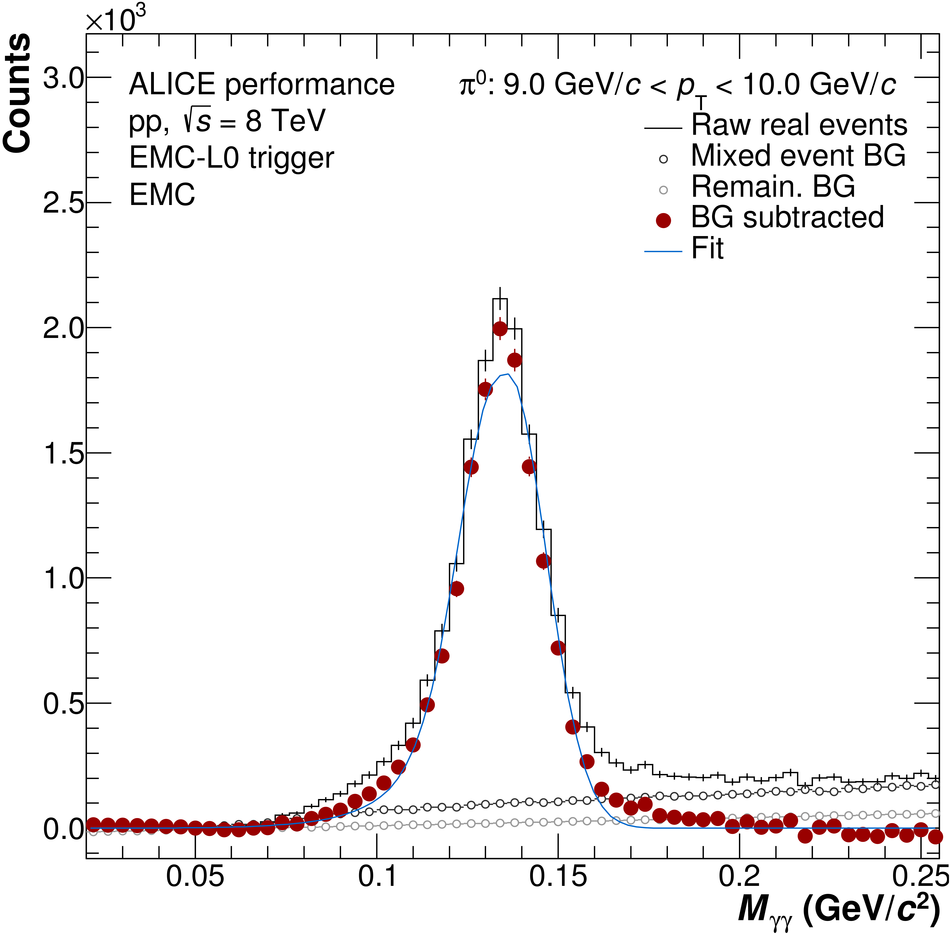 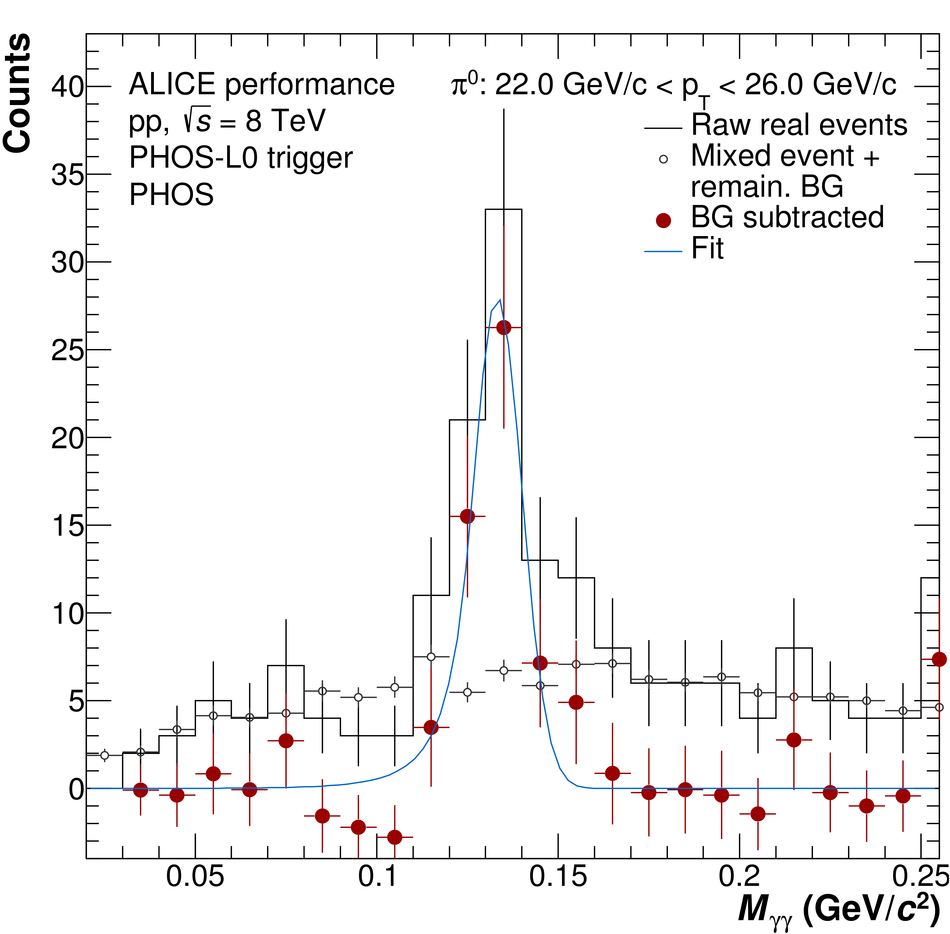 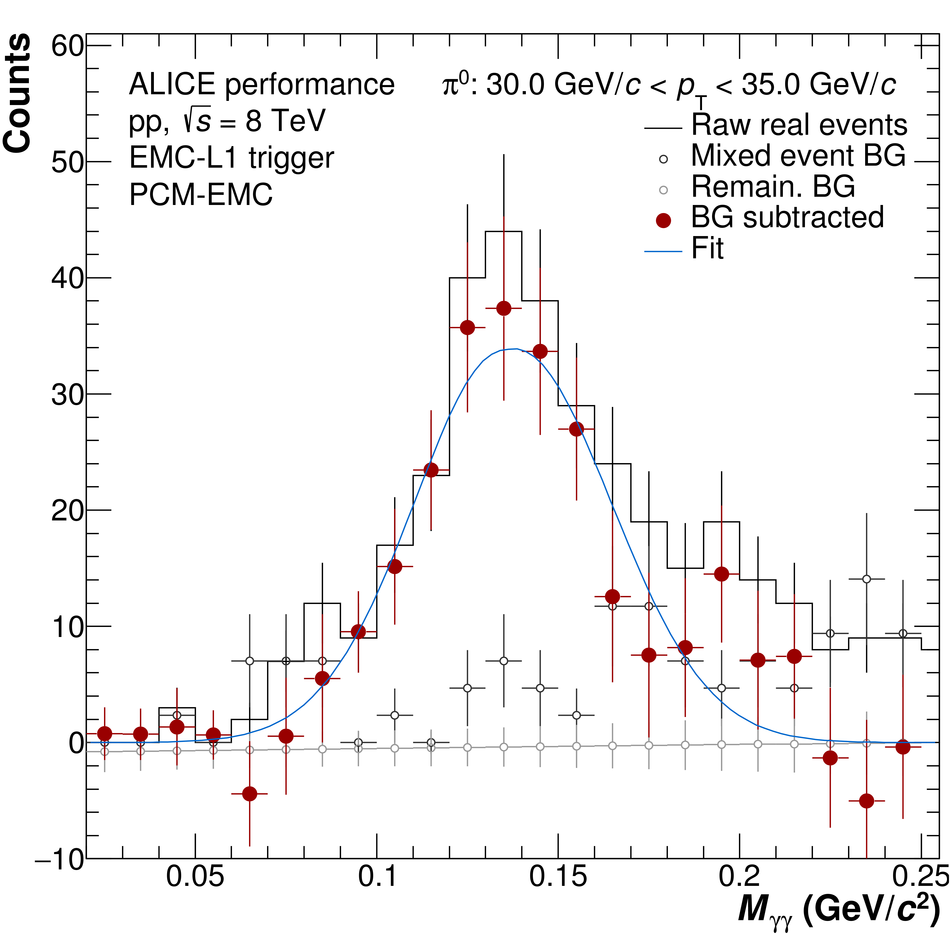 |