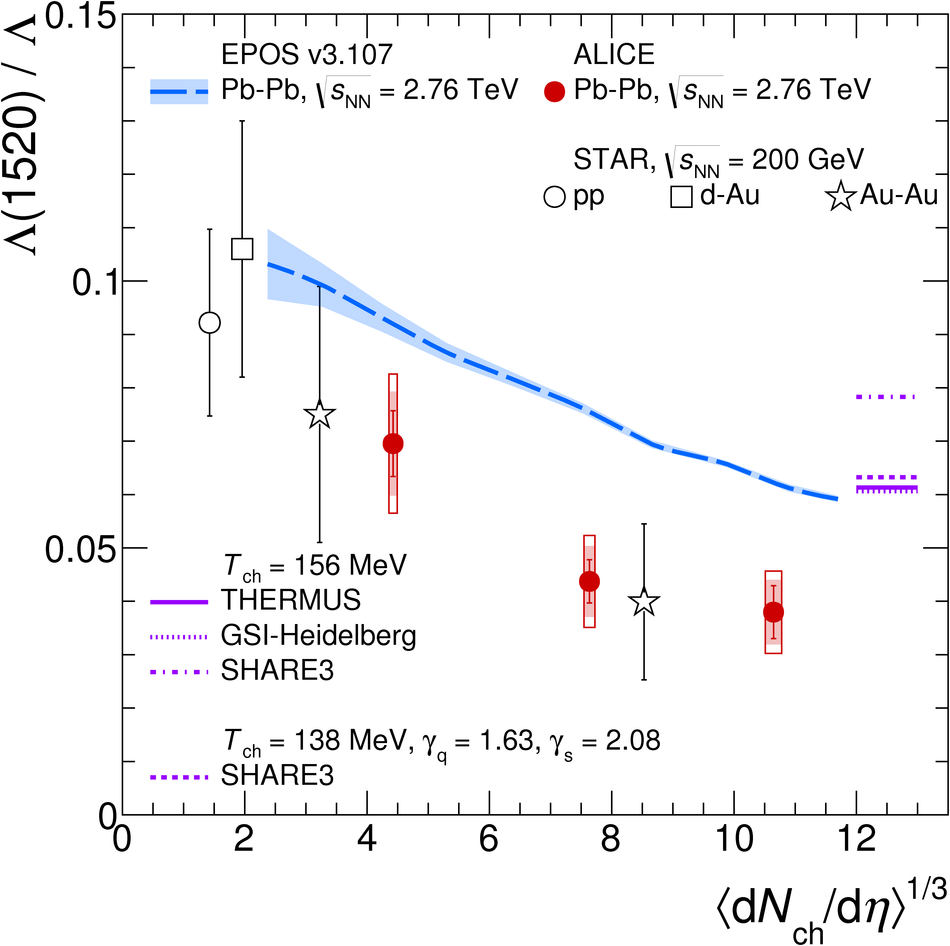
The production yield of the $\Lambda(1520)$ baryon resonance is measured at mid-rapidity in Pb-Pb collisions at $\sqrt{s_{\rm NN}}$ = 2.76 TeV with the ALICE detector at the LHC. The measurement is performed in the $\Lambda(1520)\rightarrow {\rm pK}^{-}$ (and charge conjugate) hadronic decay channel as a function of the transverse momentum ($p_{\rm T}$) and collision centrality. The $p_{\rm T}$-integrated production rate of $\Lambda(1520)$ relative to $\Lambda$ in central collisions is suppressed by about a factor of 2 with respect to peripheral collisions. This is the first observation of the suppression of a baryonic resonance at the LHC and the first 3$\sigma$ evidence of $\Lambda(1520)$ suppression within a single collision system. The measured $\Lambda(1520)/\Lambda$ ratio in central collisions is smaller than the value predicted by the statistical hadronisation model calculations. The shape of the measured $p_{\rm T}$ distribution and the centrality dependence of the suppression are reproduced by the EPOS3 Monte Carlo event generator. The measurement adds further support to the formation of a dense hadronic phase in the final stages of the evolution of the fireball created in heavy-ion collisions, lasting long enough to cause a significant reduction in the observable yield of short-lived resonances.
Phys. Rev. C 99, 024905
HEP Data
e-Print: arXiv:1805.04361 | PDF | inSPIRE
CERN-EP-2018-116
Figure 1
Example invariant-mass distributions of the \Lambdastardecay (and charged conjugate) reconstruction after subtraction of the mixed-event background The solid line represents the global fit (signal + residual background) to the data while the dashed line indicates the estimated residual background The error bars indicate the statistical uncertainties of the data. | 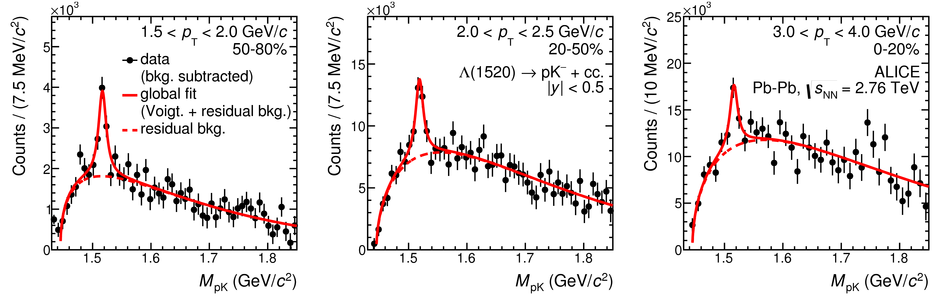 |
Figure 2
(left) \pt-differential yields of \Lambdastar at midrapidity, \yless{0.5}, in the centrality classes 0--20\%, 20--50\%, and 50--80\% The solid and dashed curves represent predictions from the Blast-Wave model (normalisation fitted to the data) and EPOS3, respectively. The horizontal error bars represents the width of the measured \pt interval. (right) Ratio of the data to the Blast-Wave and EPOS3 predictions. | 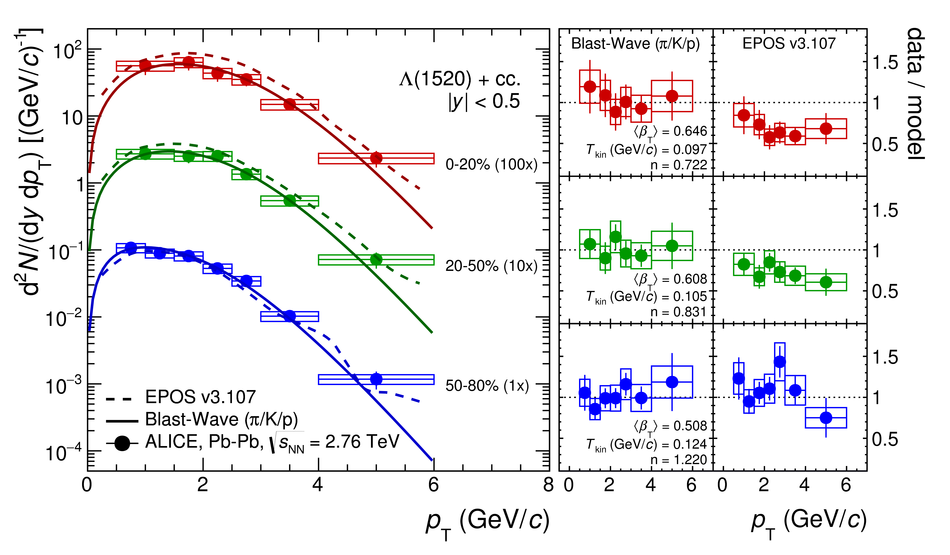 |
Figure 3
\average{\pt} of \Lambdastar as a function of \dnchdetacubic Statistical and systematic uncertainties are shown as bars and boxes, respectively The solid line shows the Blast-Wave predictions The dashed lines show the predictions from EPOS3 with and without the hadronic phase (UrQMD off). |  |