$\phi$ meson measurements provide insight into strangeness production, which is one of the key observables for the hot medium formed in high-energy heavy-ion collisions. ALICE measured $\phi$ production through its decay in muon pairs in Pb-Pb collisions at $\sqrt{s_\mathrm{NN}}$ = 2.76 TeV in the intermediate transverse momentum range $2 <~ p_{\rm T} <~ 5$ GeV/$c$ and in the rapidity interval $2.5<~y<~4$. The $\phi$ yield was measured as a function of the transverse momentum and collision centrality. The nuclear modification factor was obtained as a function of the average number of participating nucleons. Results were compared with the ones obtained via the kaon decay channel in the same $p_{\rm T}$ range at midrapidity. The values of the nuclear modification factor in the two rapidity regions are in agreement within uncertainties.
Eur. Phys. J. C 78 (2018) 559
HEP Data
e-Print: arXiv:1804.08906 | PDF | inSPIRE
CERN-EP-2018-082


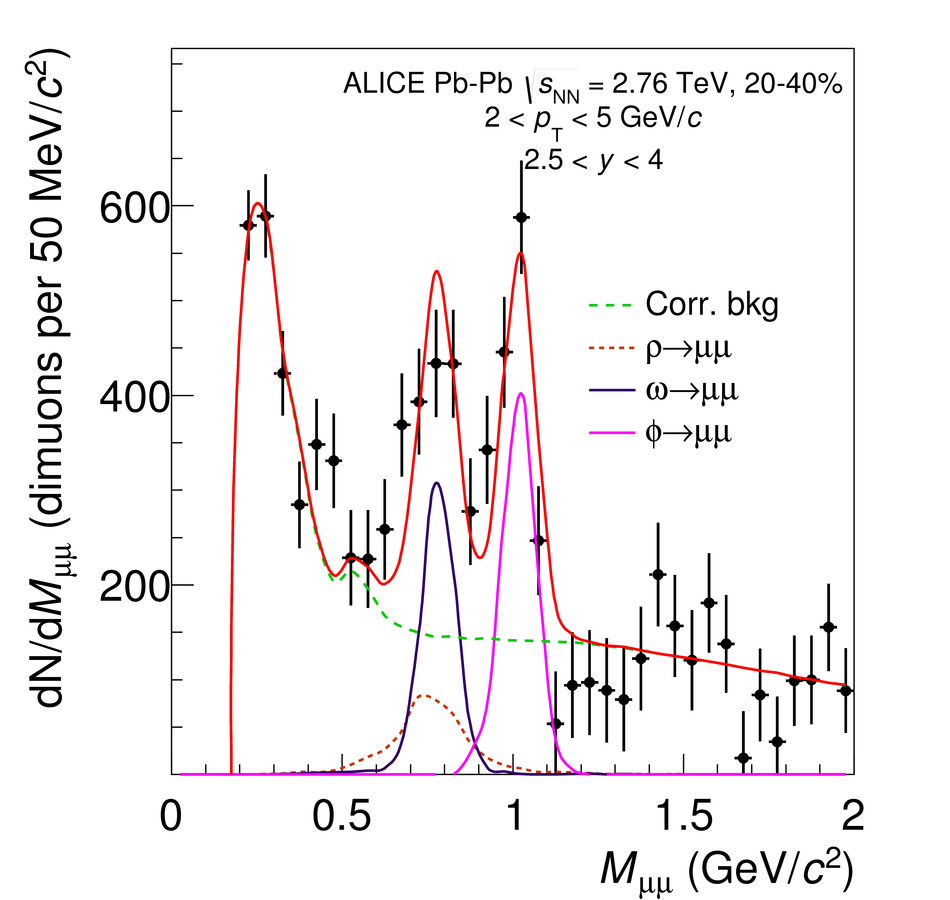
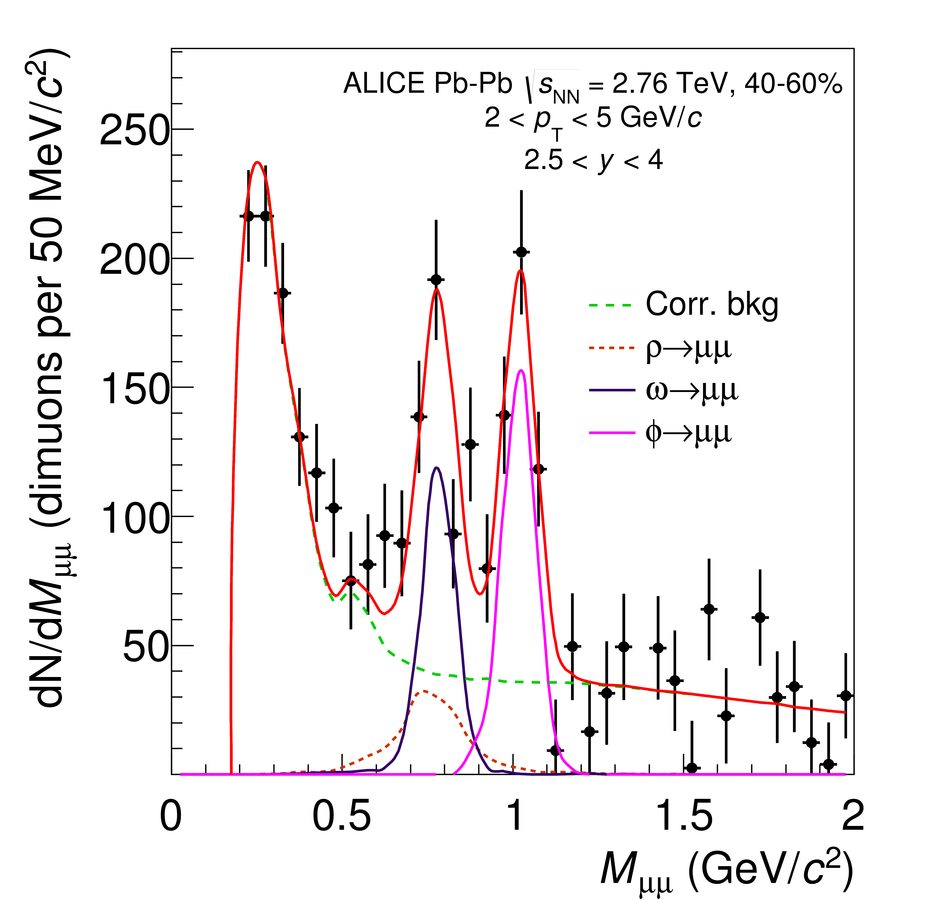

Figure 4
Invariant mass spectra for $2.5 < \pt < 3$ GeV/$c$ and $3.6 < \pt < 4.2$ GeV/$c$ in 0--90\% Pb--Pb collisions at $\sqrt{s_\mathrm{NN}}$ = 2.76 TeV. The solid red line represents the result of the fit to the hadronic cocktail; the green dashed line represents the correlated background, given by the sum of all the MC sources other than $\phi$, $\rho$ and $\omega$ mesons. | 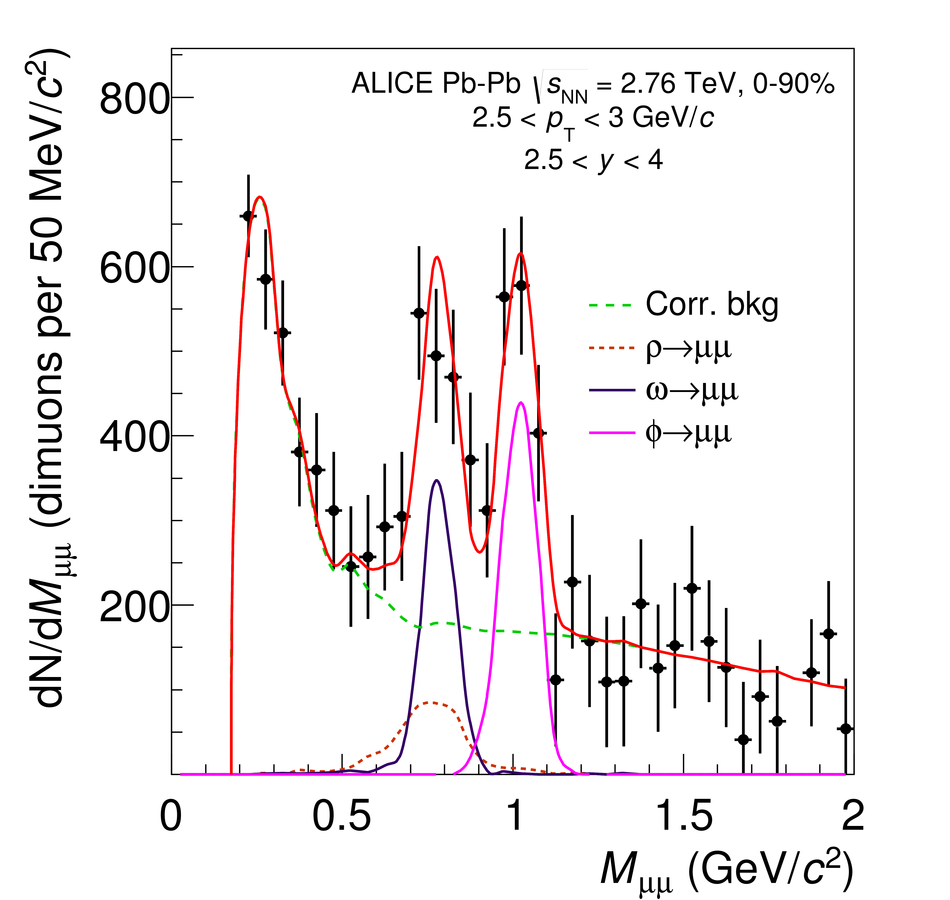 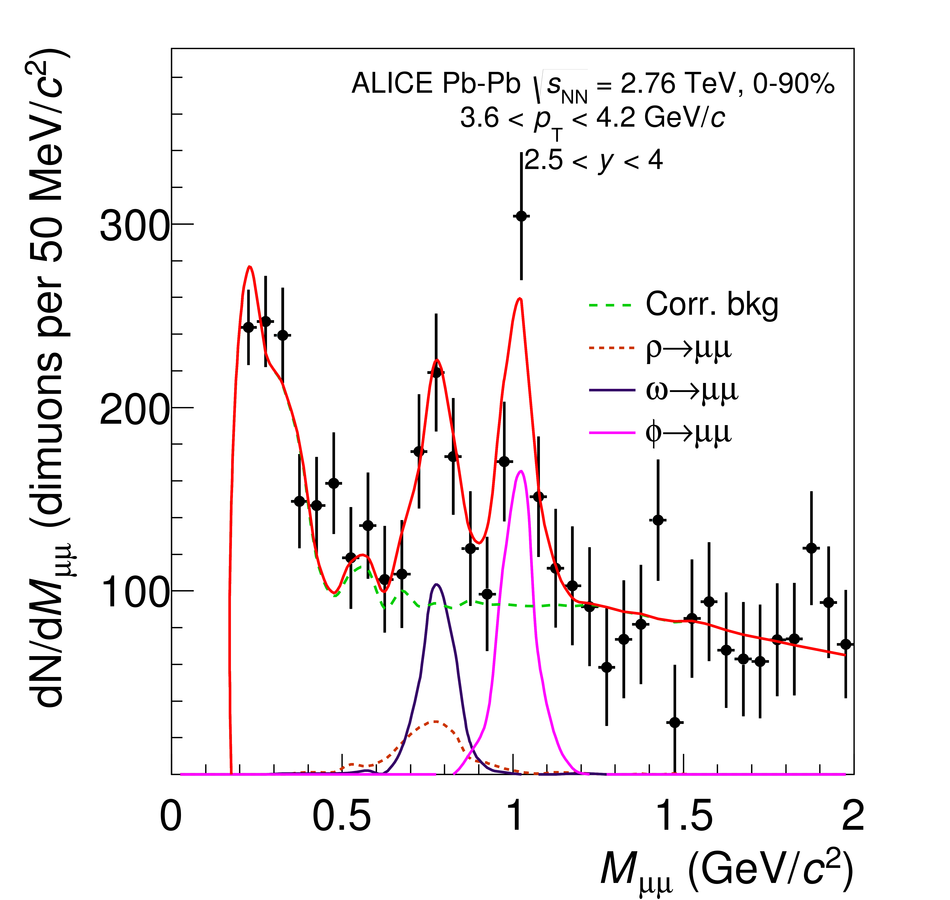 |

Figure 6
Top panel: comparison between the $\phi$ yield as a function of $\pt$ with the EPOS 3.101 and HIJING 2.0 event generators, at forward and midrapidity , for 0-40\% (left) and 40-90\% centrality (right). The same scale factors applied to data were also used for the models. The transparent boxes represent the uncorrelated systematic uncertainties at forward rapidity and the total systematic uncertainties (including correlated and uncorrelated components) at midrapidity. Lower panels: ratios between the measured yields and the calculations by EPOS and HIJING. | 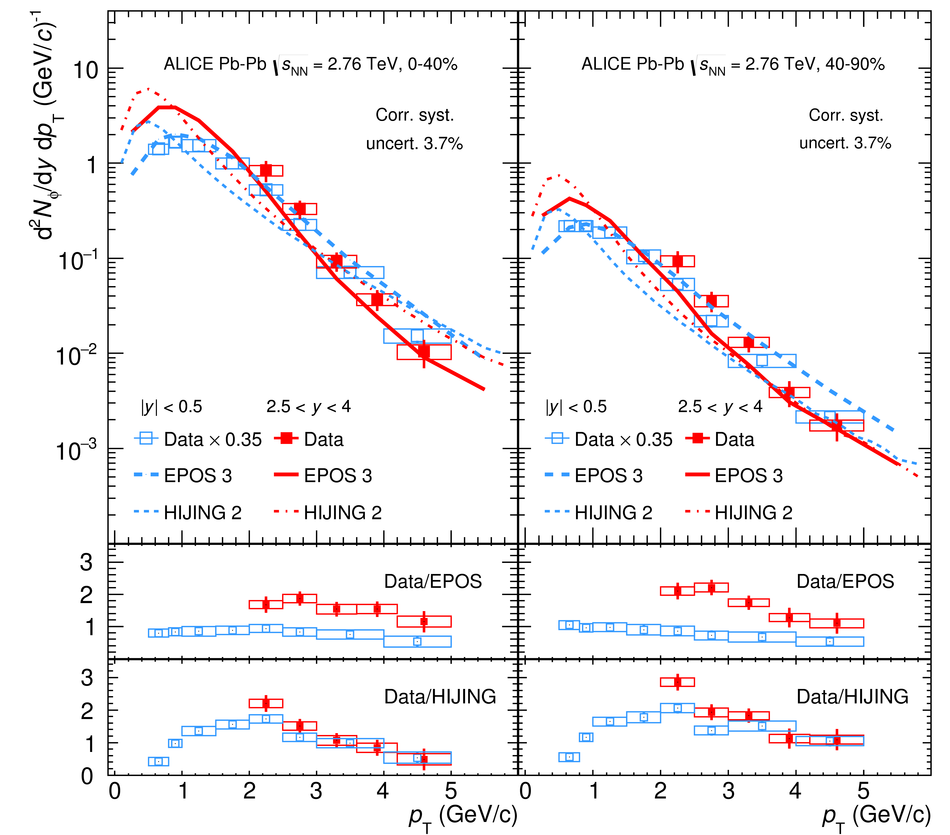 |

Figure 8
$R_{\mathrm{AA}}$ of the $\phi$ meson as a function of $\langle N_{\mathrm{part}} \rangle$ for $2.5< y< 4$, compared with the ALICE measurement for $|y|< 0.5$. All the midrapidity points have been displaced by $\npart$ = 10 for better visibility. Transparent boxes represent the uncorrelated systematic uncertainties at forward rapidity and the total systematic uncertainties (including correlated and uncorrelated components) at midrapidity The shaded red box represents the correlated systematic uncertainties at forward rapidity, the shaded blue box represents the normalization uncertainty at midrapidity. Results from PHENIX in Au-Au and Cu-Cu collisions at $\sqrt{s_\mathrm{NN}}$ = 200 GeV are also shown for comparison. | 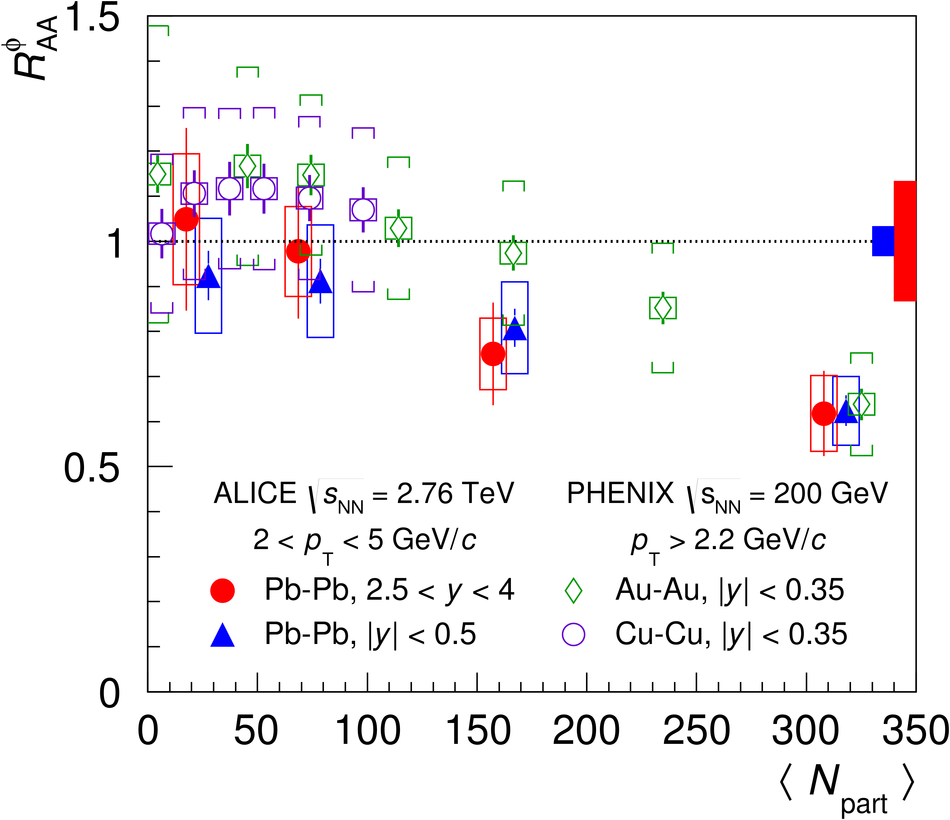 |