The production of $\mathrm{K}^{*}(\mathrm{892})^{0}$ and $\mathrm{\phi(1020)}$ in pp collisions at $\sqrt{s}$ = 8 TeV was measured using Run 1 data collected by the ALICE collaboration at the LHC. The $p_{\rm{T}}$-differential yields d$^{\rm 2}N$/d$y$d$p_{\rm{T}}$ in the range $0 <~ p_{\rm{T}} <~ 20$ GeV/$c$ for $\rm{K}^{*0}$ and $0.4 <~ p_{\rm{T}} <~ 16$ GeV/$c$ for $\phi$ have been measured at midrapidity, $|y| <~ 0.5$. Moreover, improved measurements of the $\rm{K}^{*}(892)^{0}$ and $\phi(1020)$ at $\sqrt{s} = 7$TeV are presented. The collision energy dependence of $p_{\rm{T}}$ distributions, $p_{\rm{T}}$-integrated yields and particle ratios in inelastic pp collisions are examined. The results are also compared with different collision systems. The values of the particle ratios are found to be similar to those measured at other LHC energies. In pp collisions a hardening of the particle spectra is observed with increasing energy, but at the same time it is also observed that the relative particle abundances are independent of the collision energy. The $p_{\rm{T}}$-differential yields of $\rm{K}^{*0}$ and $\phi$ in pp collisions at $\sqrt{s} = 8$ TeV are compared with the expectations of different Monte Carlo event generators.
Phys. Rev. C 102 (2020) 024912
HEP Data
e-Print: arXiv:1910.14410 | PDF | inSPIRE
CERN-EP-2019-248

Figure 2
Upper panels shows the $\pT$ spectra of $\ks$ and $\ph $ in inelastic pp collisions at 7 TeV (left) and 8 TeV (right) and fitted with the L\'evy-Tsallis distribution . The normalization uncertainty in the spectra is $^{+7.3}_{-3.5}$\% for 7 TeV and 2.69\% for 8 TeV. The vertical bars show statistical and the boxes show systematic uncertainties. The lower panels show the ratio of data to the L\'evy-Tsallis fit. Here, the bars show the systematic uncertainty. | 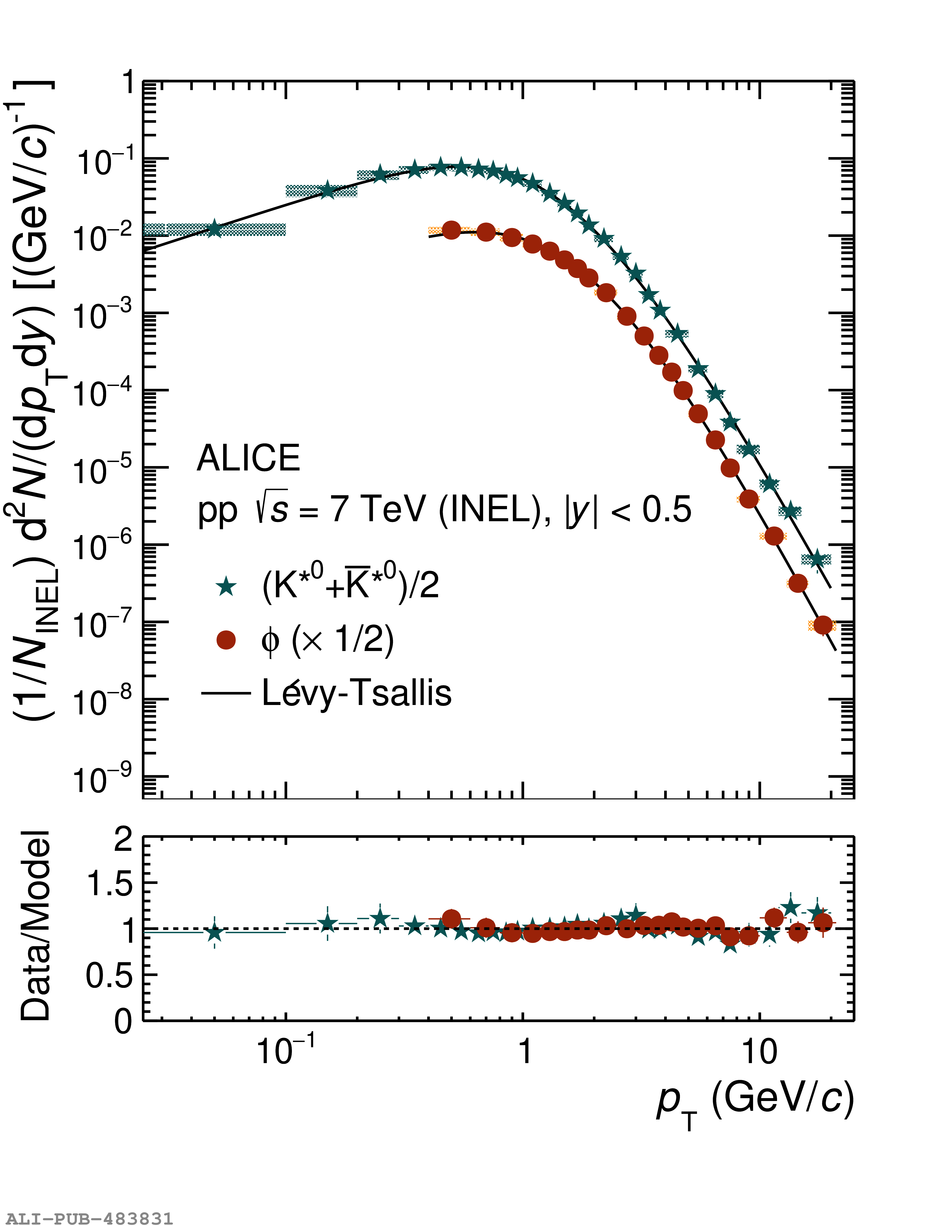 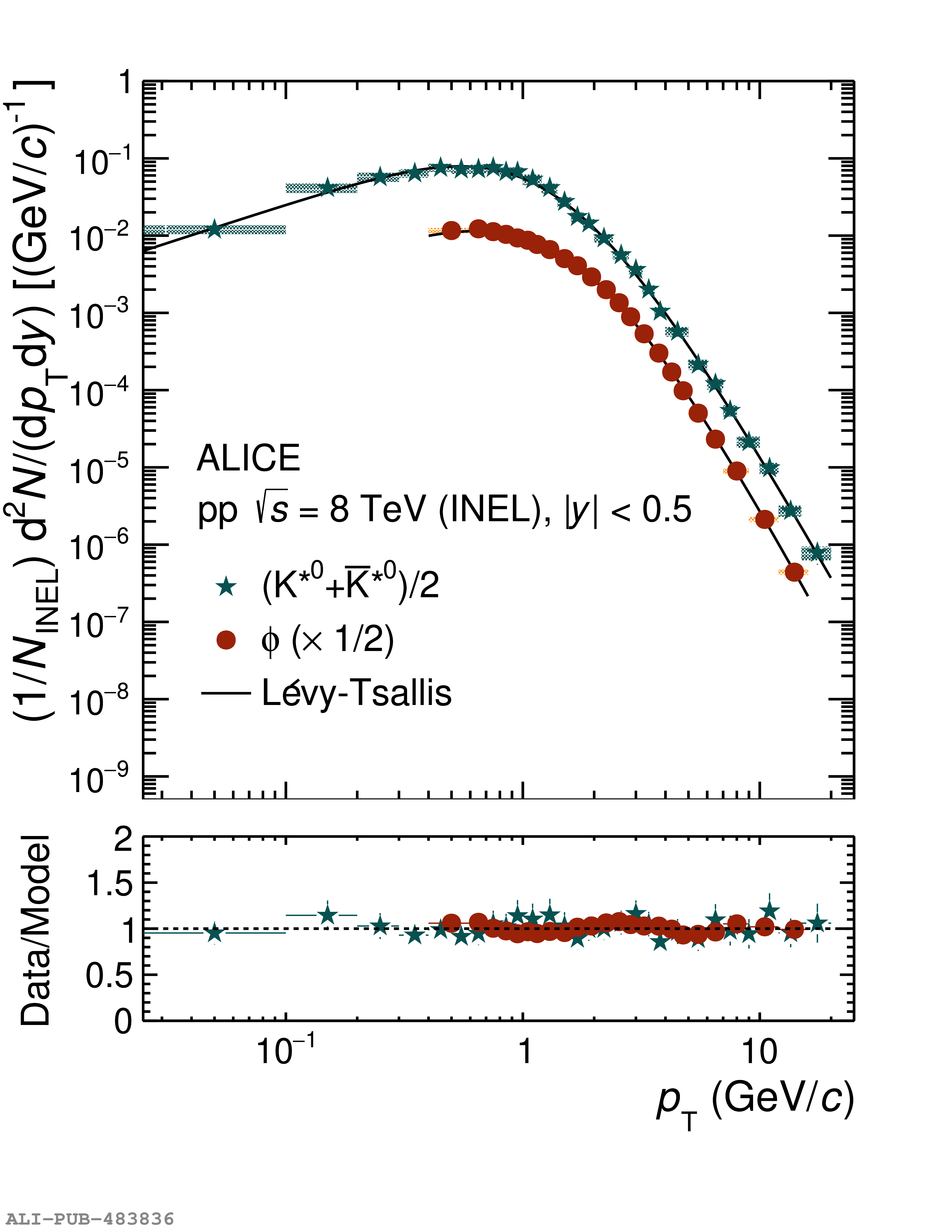 |
Figure 3
Ratios of transverse-momentum spectra of $\ks$ and $\ph $ in inelastic events at $\sqrt{s}$ = 7 and 8 TeV to the transverse-momentum spectra in pp collisions at $\sqrt{s}$ = 2.76 TeV. The statistical and systematic uncertainties are shown as vertical error bars and boxes, respectively. The normalization uncertainties are indicated by boxes around unity. | 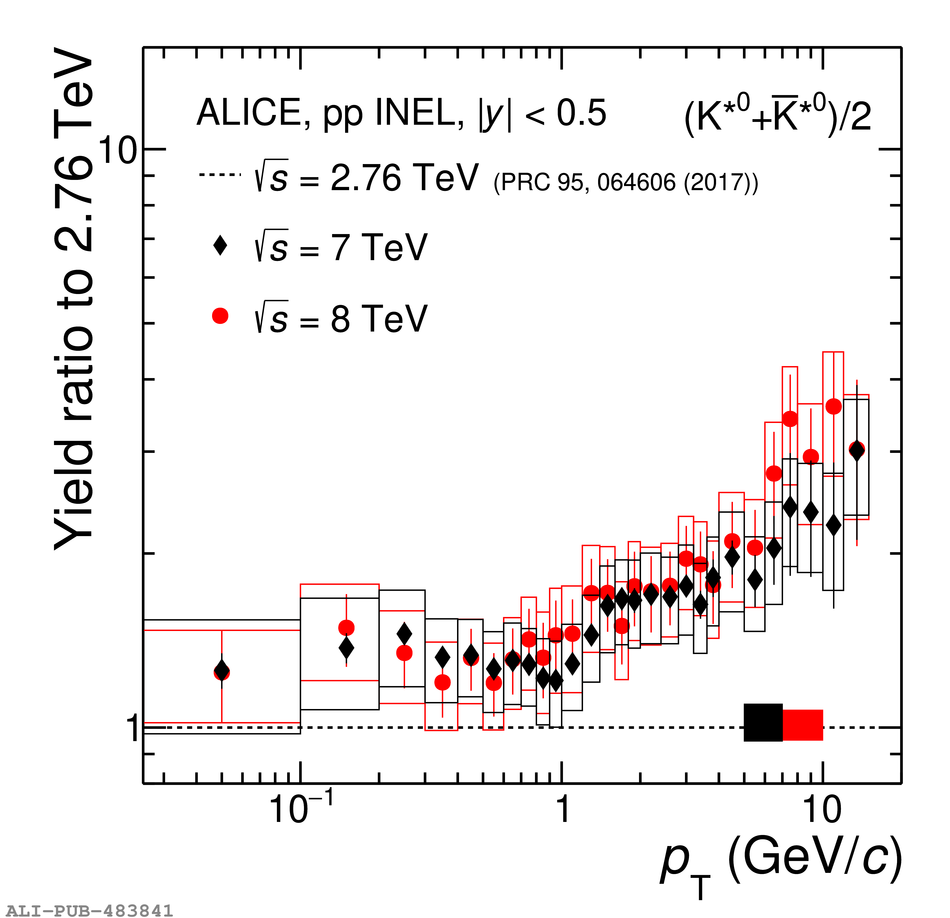 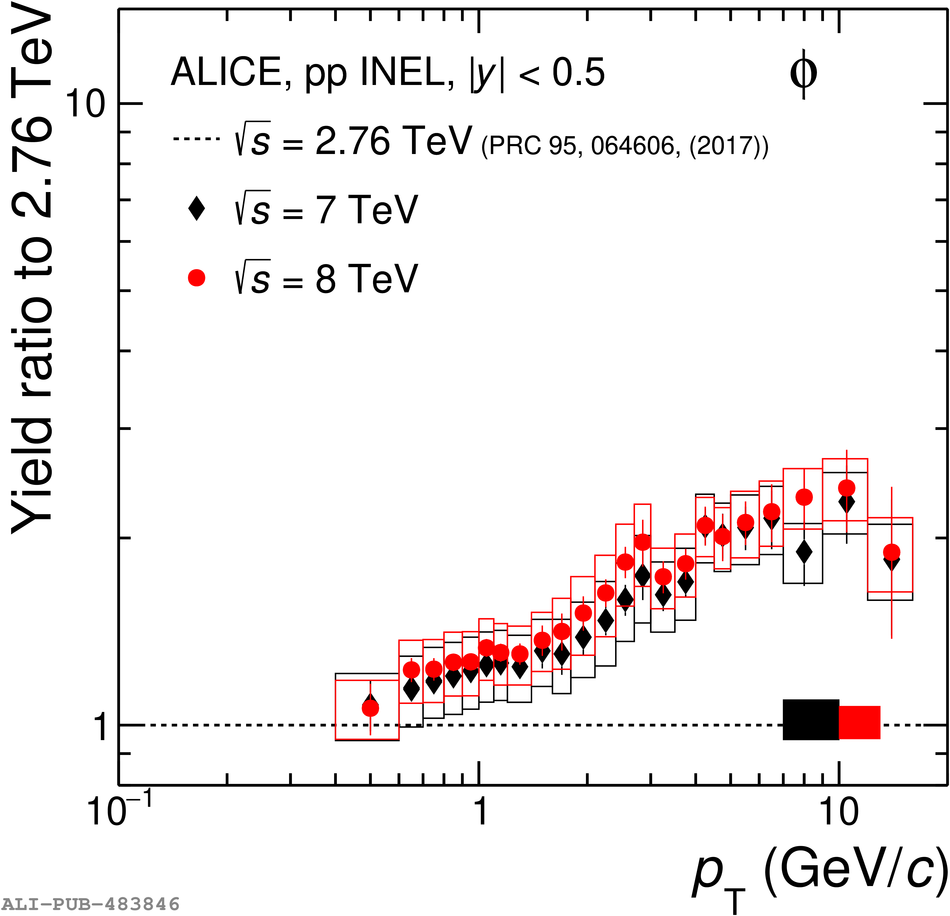 |
Figure 5
Particle ratios of $\ks$/K (left) and $\ph$/K (right) are presented for pp, high-multiplicity p--Pb, central d--Au, and central A--A collisions as a function of the collision energy. Bars (when present) represent statistical uncertainties. Boxes represent the total systematic uncertainties or the total uncertainties for cases when separate statistical uncertainties were not reported. The value given by a grand-canonical thermal model with a chemical freeze-out temperature of 156 MeV is also shown. | 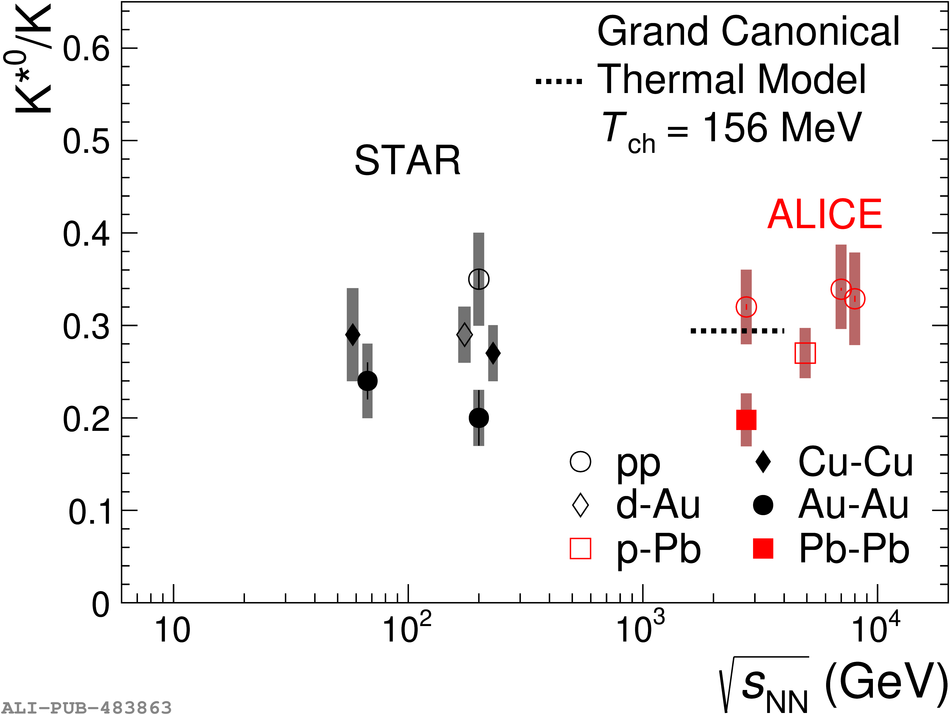 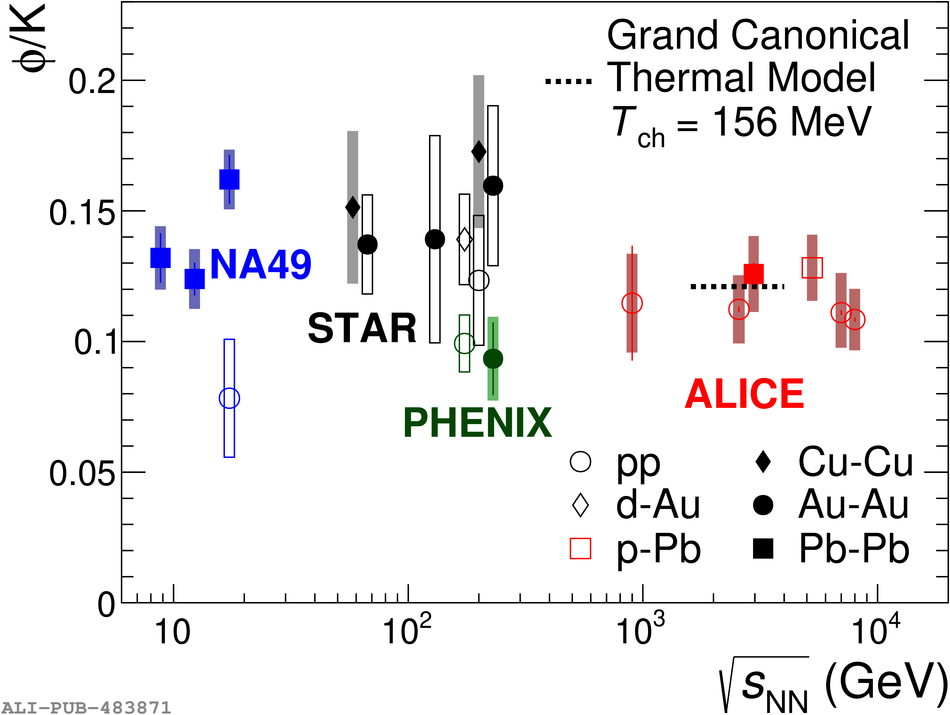 |
Figure 6
Particle ratio $\ph$/ $\ks$ presented for pp collisions as a function of the collision energy. Bars (when present) represent statistical uncertainties. Boxes represent the total systematic uncertainties or the total uncertainties for cases when separate statistical uncertainties were not reported. | 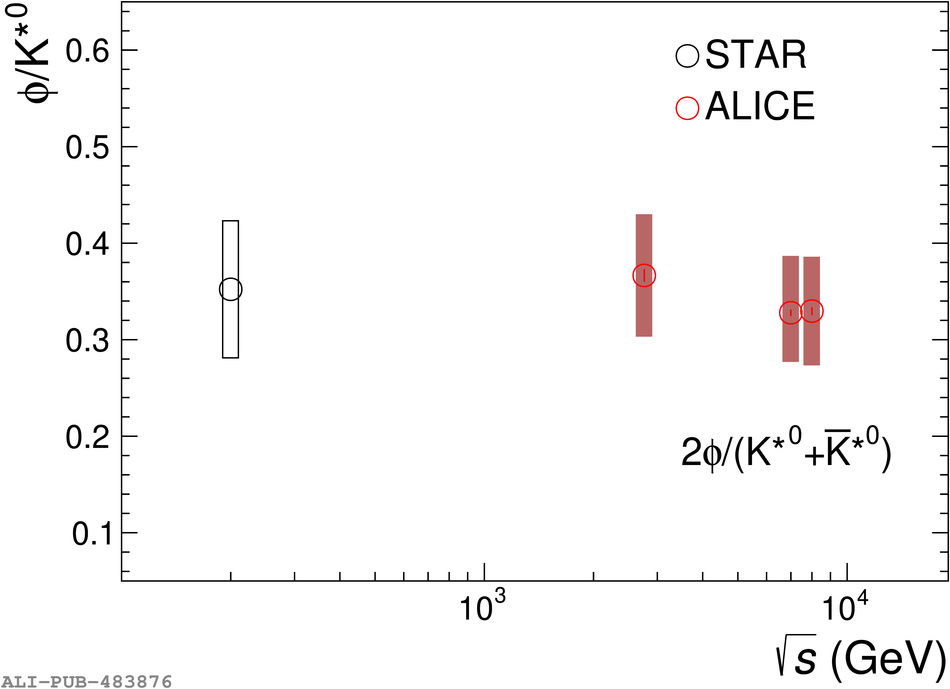 |
Figure 7
Comparison of the $\ks$ (left) and $\ph$ (right) $\pT$ spectra measured in inelastic pp collisions with those obtained from PYTHIA8 (Monash tune) , PHOJET and EPOS-LHC . The bottom plots show the ratios of the $\pT$ spectra from the models to the measured $\pT$ spectra by ALICE. The total fractional uncertainties of the data are shown as shaded boxes. | 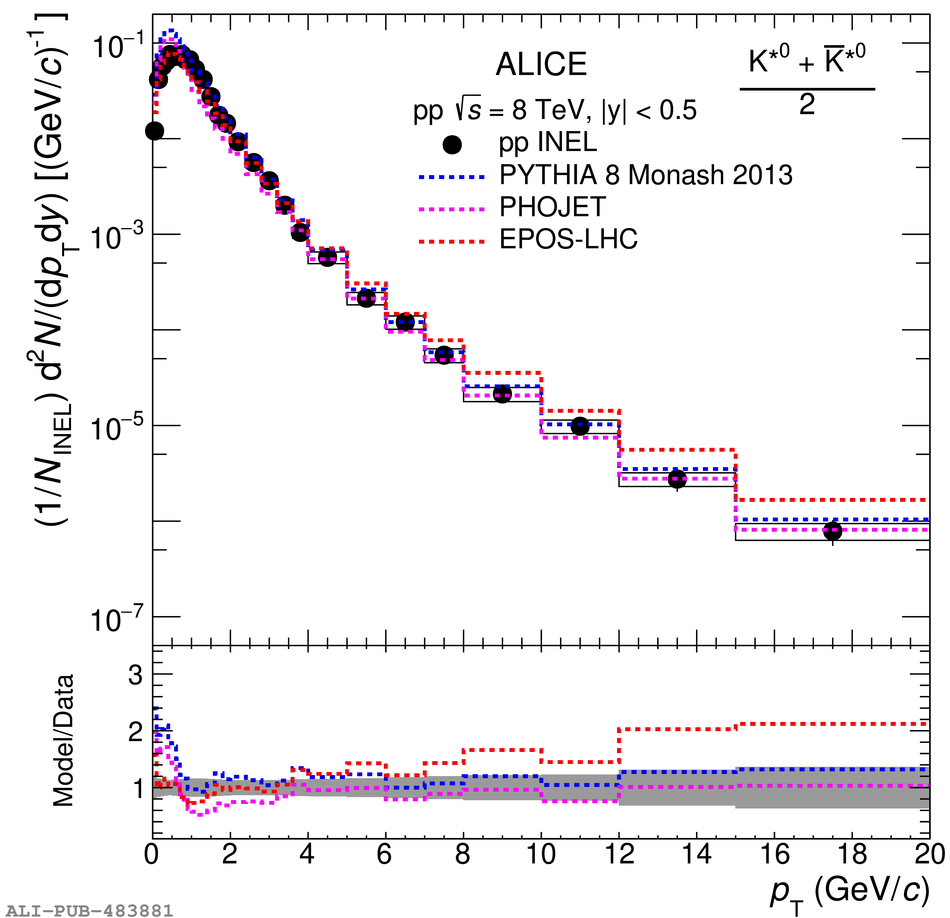 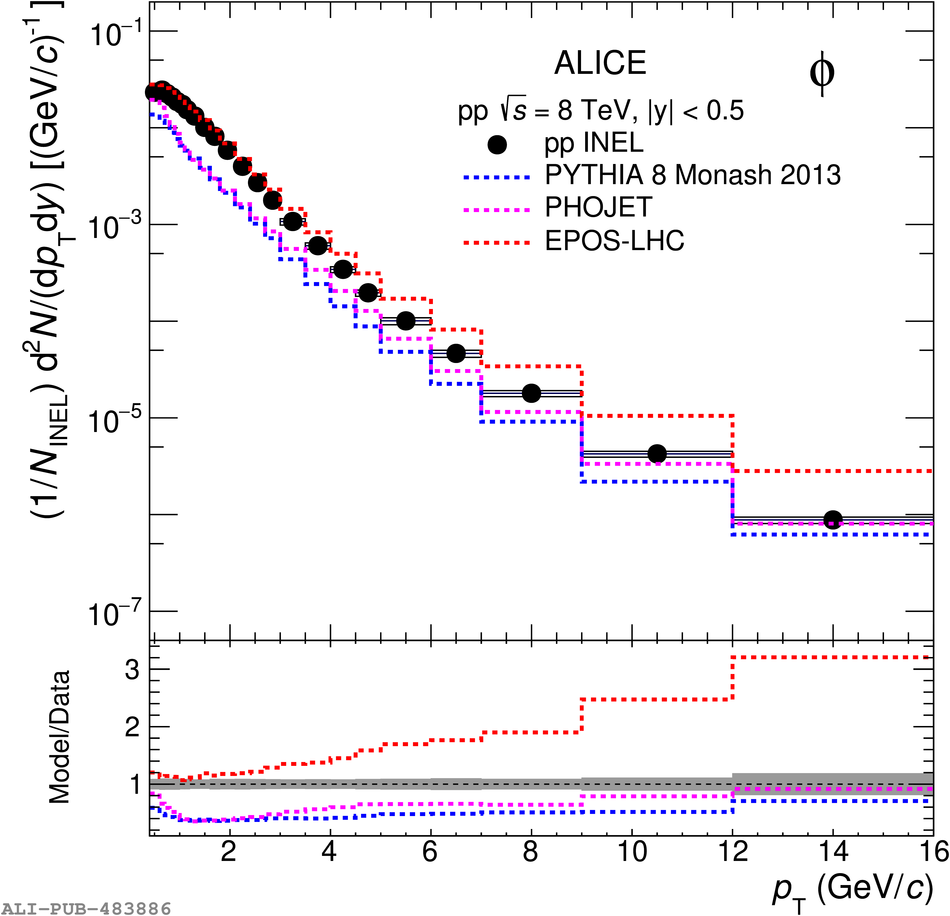 |