The ALICE Collaboration reports the measurement of semi-inclusive distributions of charged-particle jets recoiling from a high-transverse momentum trigger hadron in p-Pb collisions at $\sqrt{s_{\rm NN}} =5.02$ TeV. Jets are reconstructed from charged-particle tracks using the anti-$k_{\rm T}$ algorithm with resolution parameter $R=0.2$ and $0.4$. A data-driven statistical approach is used to correct the uncorrelated background jet yield. Recoil jet distributions are reported for jet transverse momentum $15<~p_{\rm T,jet}^{\rm ch} <~50$ GeV/$c$ and are compared in various intervals of p-Pb event activity, based on charged-particle multiplicity and zero-degree neutral energy in the forward (Pb-going) direction. The semi-inclusive observable is self-normalized and such comparisons do not require the interpretation of p-Pb event activity in terms of collision geometry, in contrast to inclusive jet observables. These measurements provide new constraints on the magnitude of jet quenching in small systems at the LHC. In p-Pb collisions with high event activity, the average medium-induced out-of-cone energy transport for jets with $R=0.4$ and $15<~p_{\rm T,jet}^{\rm ch}<~50$ GeV/$c$ is measured to be less than 0.4 GeV/$c$ at 90% confidence, which is over an order of magnitude smaller than a similar measurement for central Pb-Pb collisions at $\sqrt{s_{\rm NN}}=2.76$ TeV. Comparison is made to theoretical calculations of jet quenching in small systems, and to inclusive jet measurements in p-Pb collisions selected by event activity at the LHC and in d-Au collisions at RHIC.
Phys. Lett. B 783 (2018) 95-113
HEP Data
e-Print: arXiv:1712.05603 | PDF | inSPIRE
CERN-EP-2017-324
Figure 1
Distribution of event activity EA in decile bins measured in ZNA (left) and V0A (right), for the MB event population and for event populations selected with the requirement of a high-\pT\ trigger hadron in the intervals $6< \pTtrig< 7$\,\gev\ (TT\{6,7\}) and $12< \pTtrig< 50$\,\gev\ (TT\{12,50\}). Large EA is to the left, with the 0-10\% bin representing the largest EA, or highest amplitude signal in ZNA or V0A. | 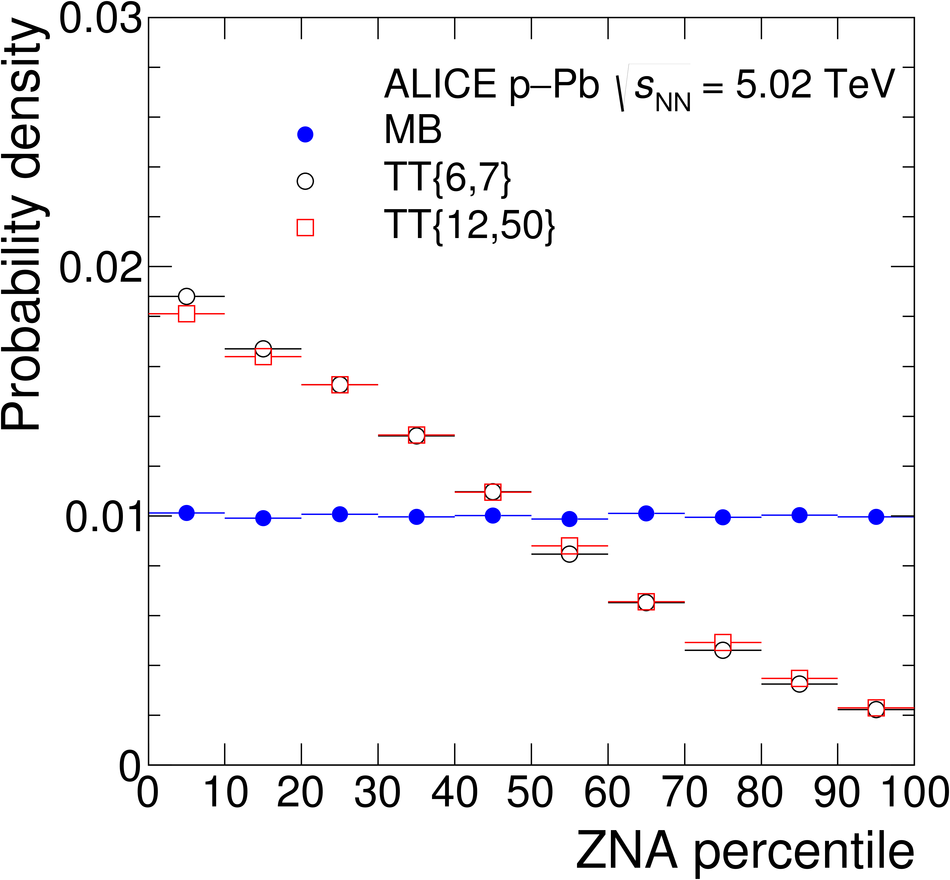 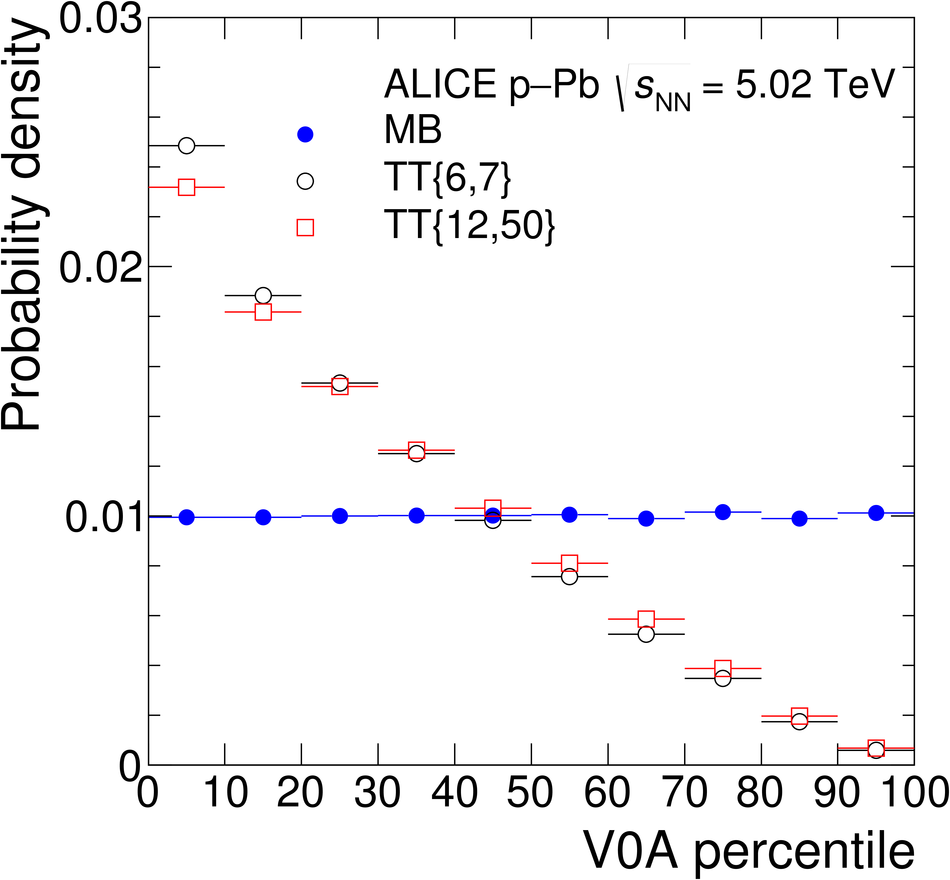 |
Figure 2
Uncorrected semi-inclusive distributions of charged jets recoiling from a high-\pT\ hadron trigger in \pPb\ collisions at $\sqrtsNN = 5.02$\,TeV with the EA selection of 50--100\% in ZNA for $\rr = 0.4$ (top panels), and with the EA selection of 0-20\% in ZNA for $ \rr = 0.2$ (middle panels) and $\rr = 0.4$ (bottom panels). The acceptance for TT and recoil jets in the CM frame are denoted \ystarTT\ and \ystarjet, respectively. Left panels: raw distributions for TT\{12,50\} (red circles) and TT\{6,7\} (blue boxes), and the corresponding \Drecoil\ distribution (Eq. \ref{eq:Drecoil}, black circles). Right panels: ratio of yields for TT\{12,50\}/TT\{6,7\} measured by ALICE in \pPb\ collisions and calculated using detector level PYTHIA Perugia 11 simulation of \pp\ collisions at $\sqrts = 5.02$\,TeV. The PYTHIA-generated ratios in the top right and bottom right panels are the same. The arrow indicates the 0--1\,\gev\ bin which is used to calculate \cRef. The uncertainties are statistical only | 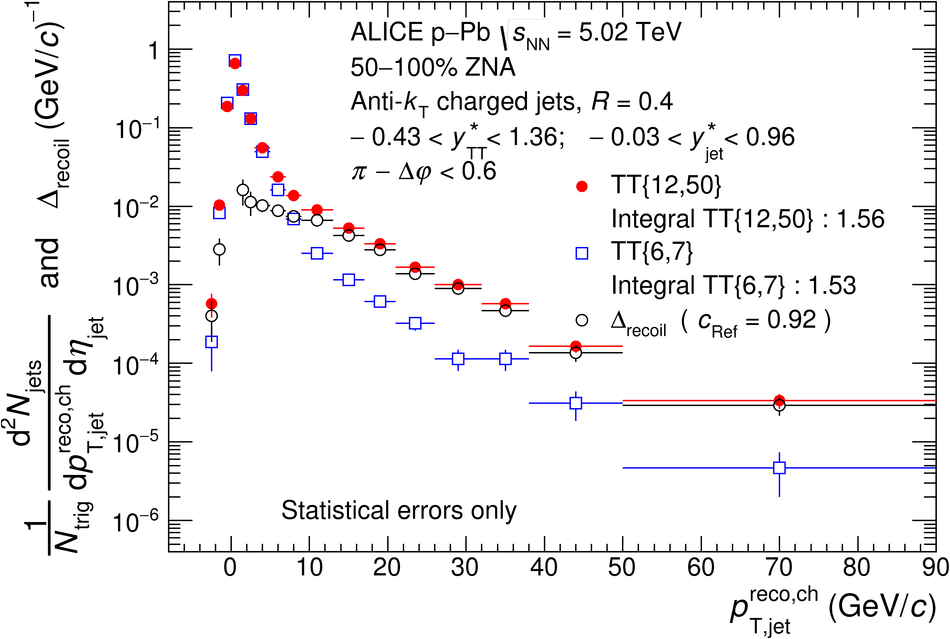  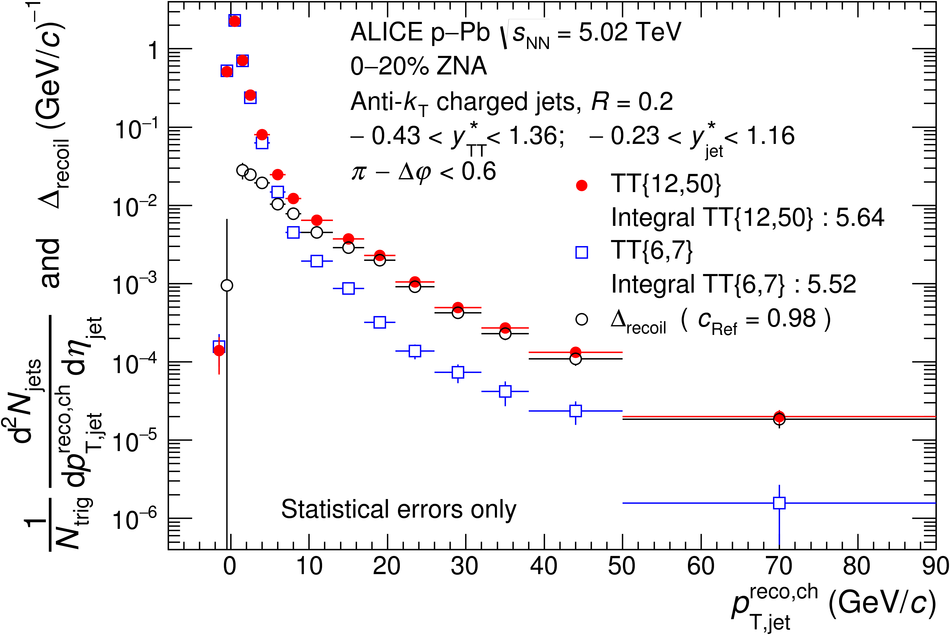  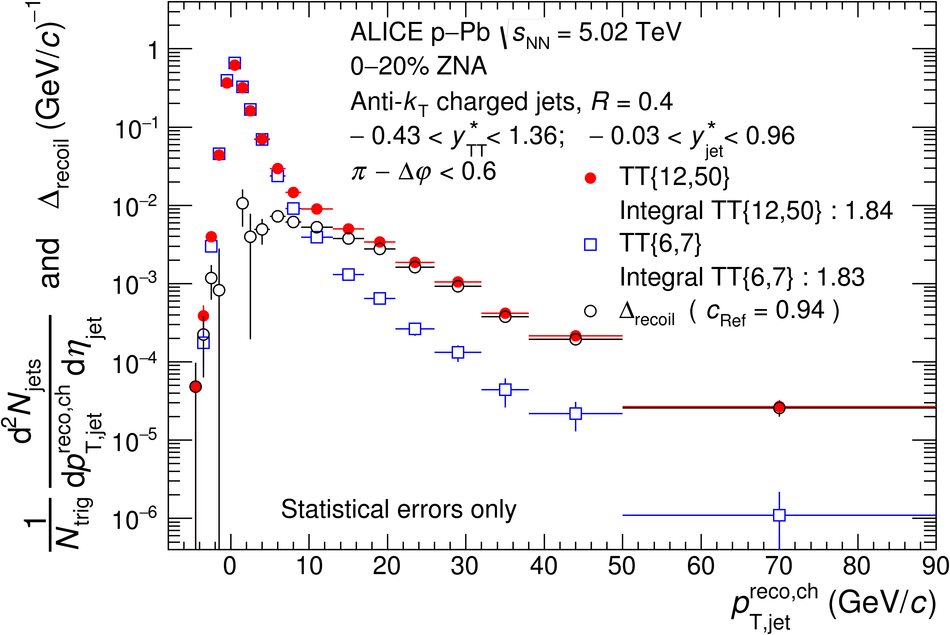 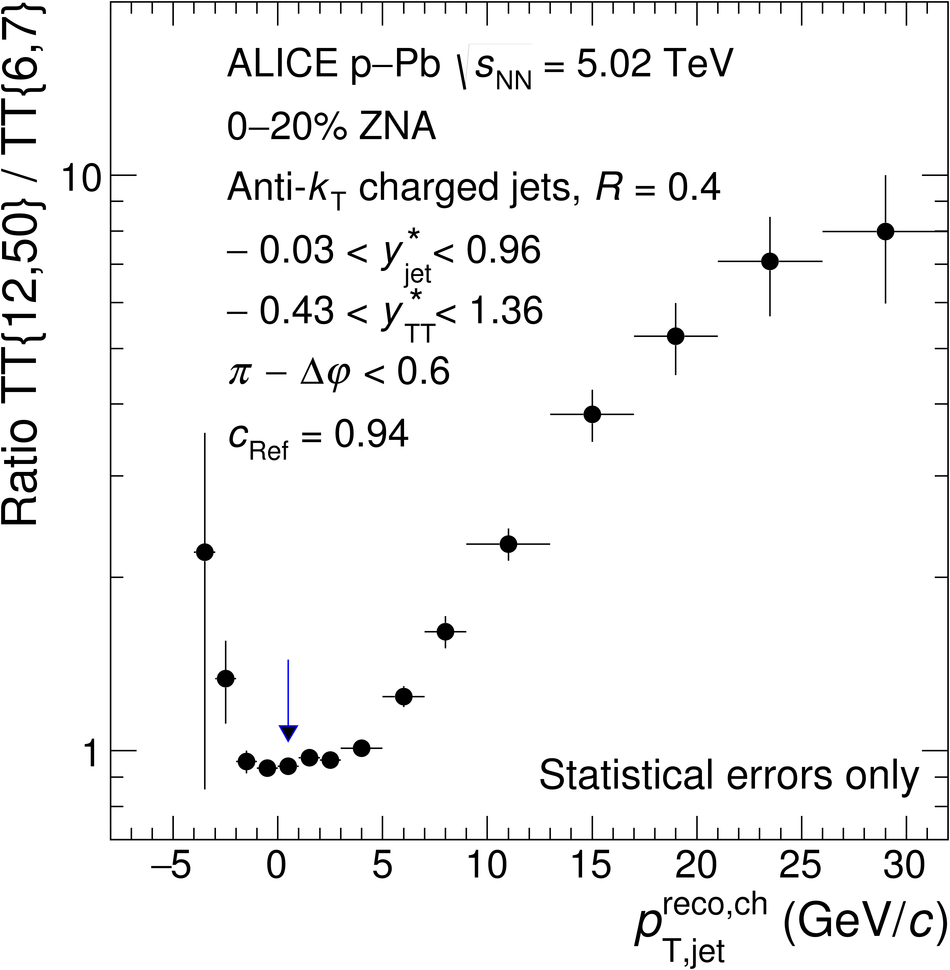 |
Figure 3
Corrected \Drecoil\ distributions measured for \pPb\ collisions at $\sqrtsNN = 5.02$\,TeV, for the MB and EA-selected populations. The acceptance for TT and recoil jets in the CM frame are denoted \ystarTT\ and \ystarjet, respectively. Left panels: $\rr=0.2$; right panels: $\rr=0.4$. Also shown are \Drecoil\ distributions for \pp\ collisions at $\sqrts = 5.02$ TeV simulated by PYTHIA 6 Tune Perugia 11 and PYTHIA 8 Tune 4C. The solid line in the upper panels is the fit of an exponential function to the \pPb\ distribution, with fit parameters as specified. Lower panels: ratio of \pPb\ MB and \pp\distributions to the fit function. | 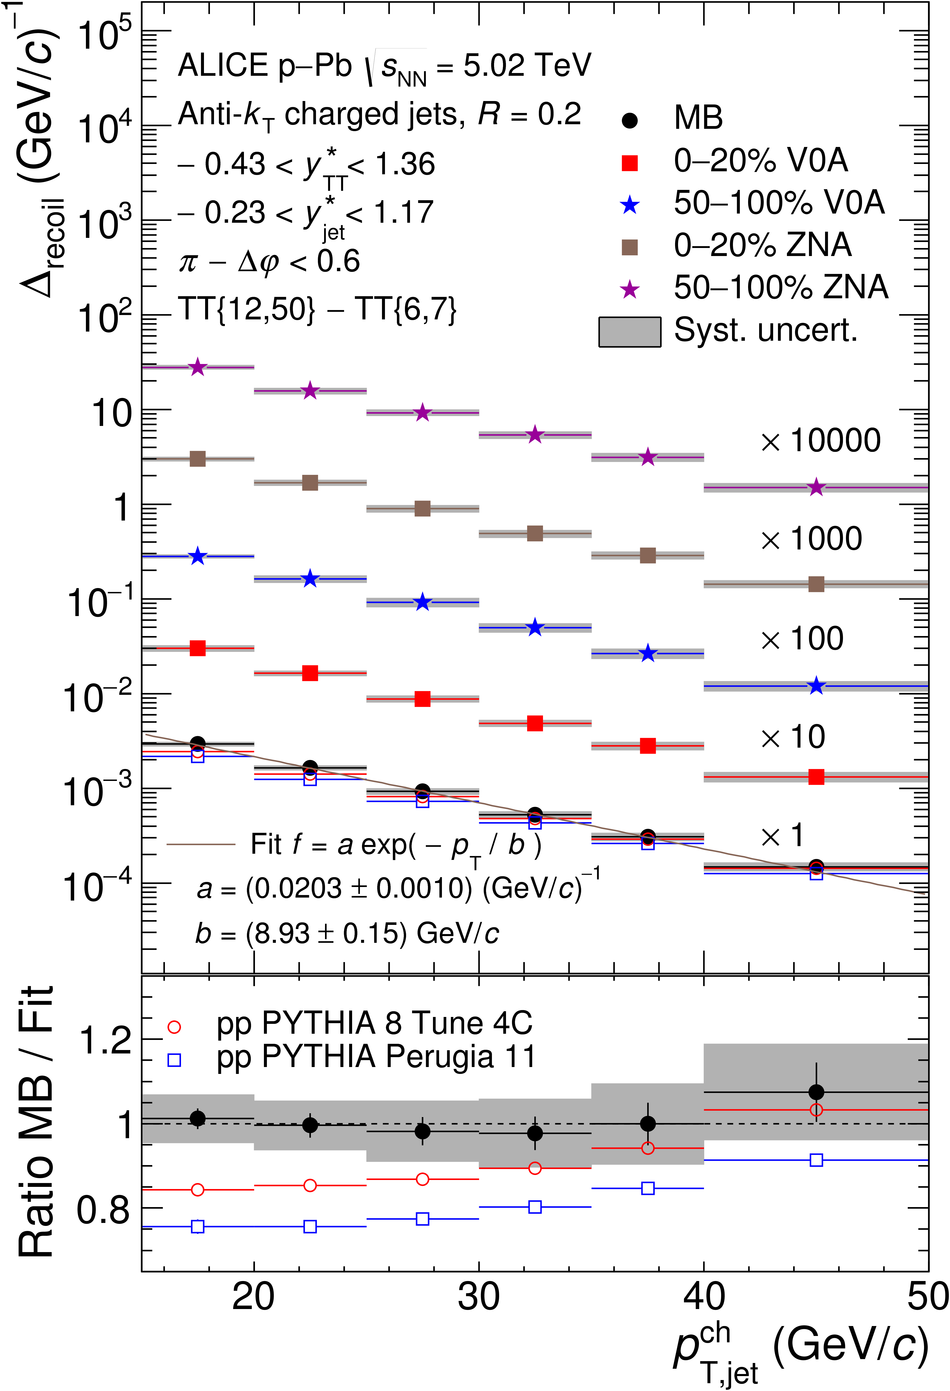 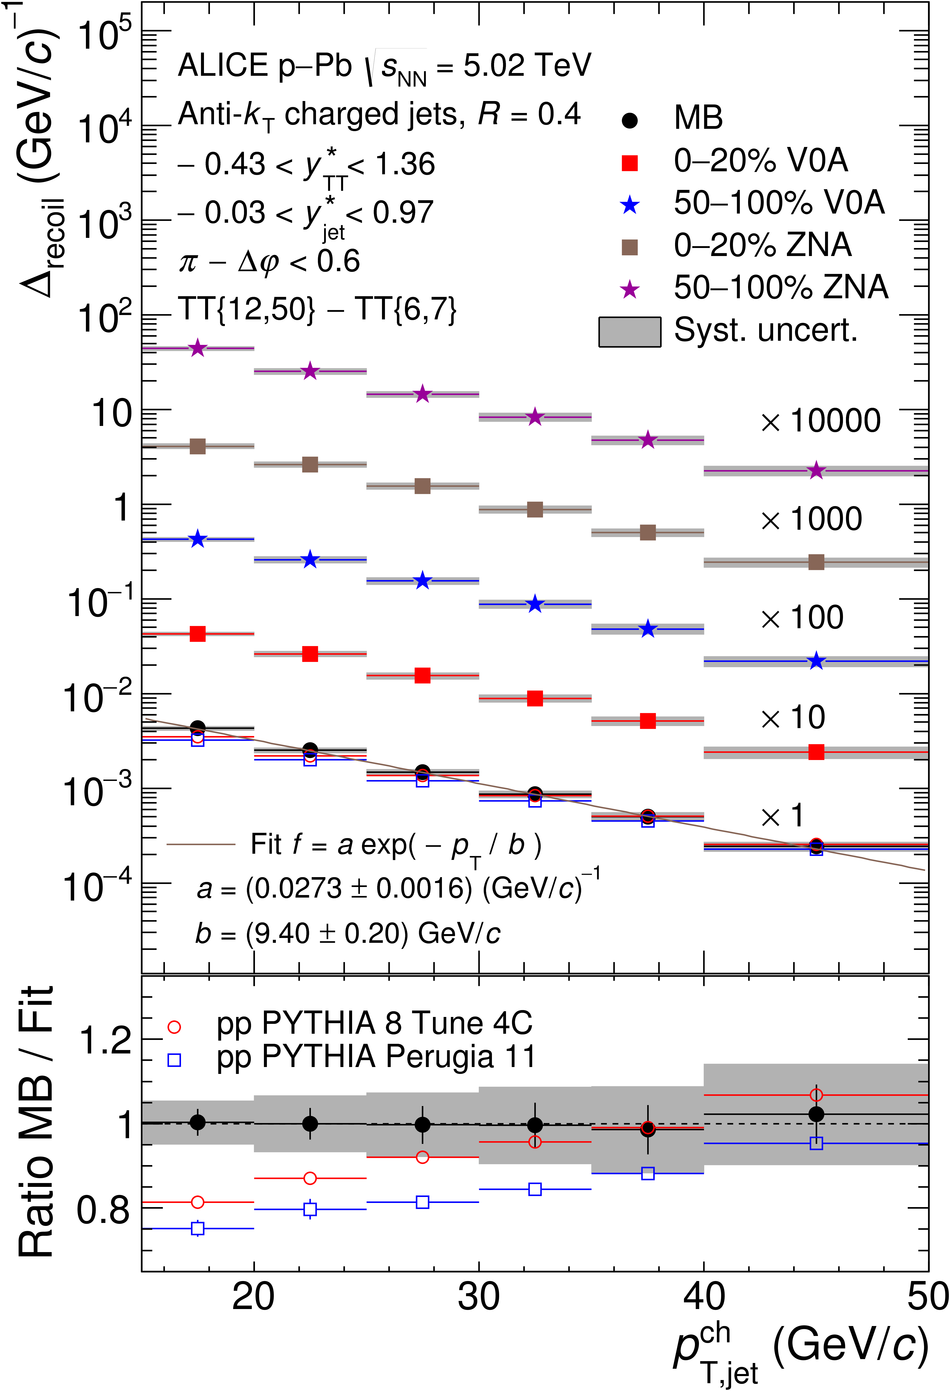 |
Figure 4
Ratio of \Drecoil\ distributions for events with high and low EA measured in \pPb\ collisions at $\sqrtsNN =5.02$\,TeV. Left panels: V0A 0--20\% / 50--100\%; right panels: ZNA 0--20\% / 50--100\%. Upper panels: $\rr= 0.2$; lower panels: $\rr =0.4$. The grey boxes show the systematic uncertainty of the ratio, which takes into account the correlated uncertainty of numerator and denominator The red line indicates the ratio for a \pT-shift of the high-EA distribution of $-0.4$\,\gev. |  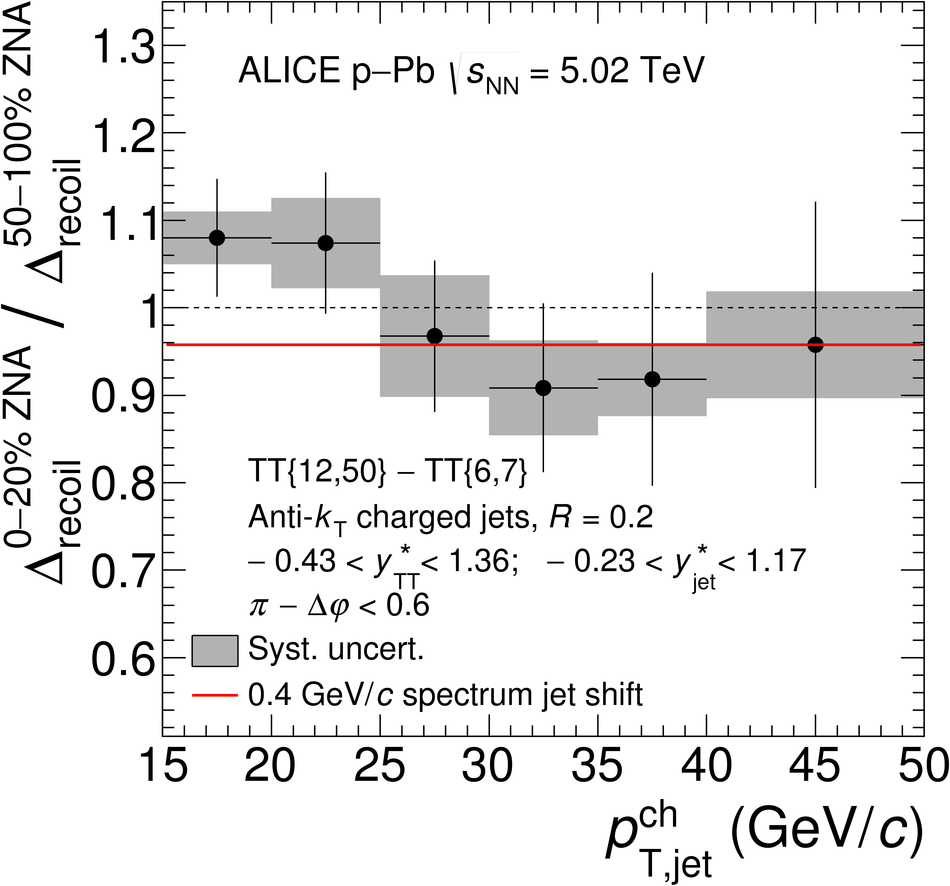 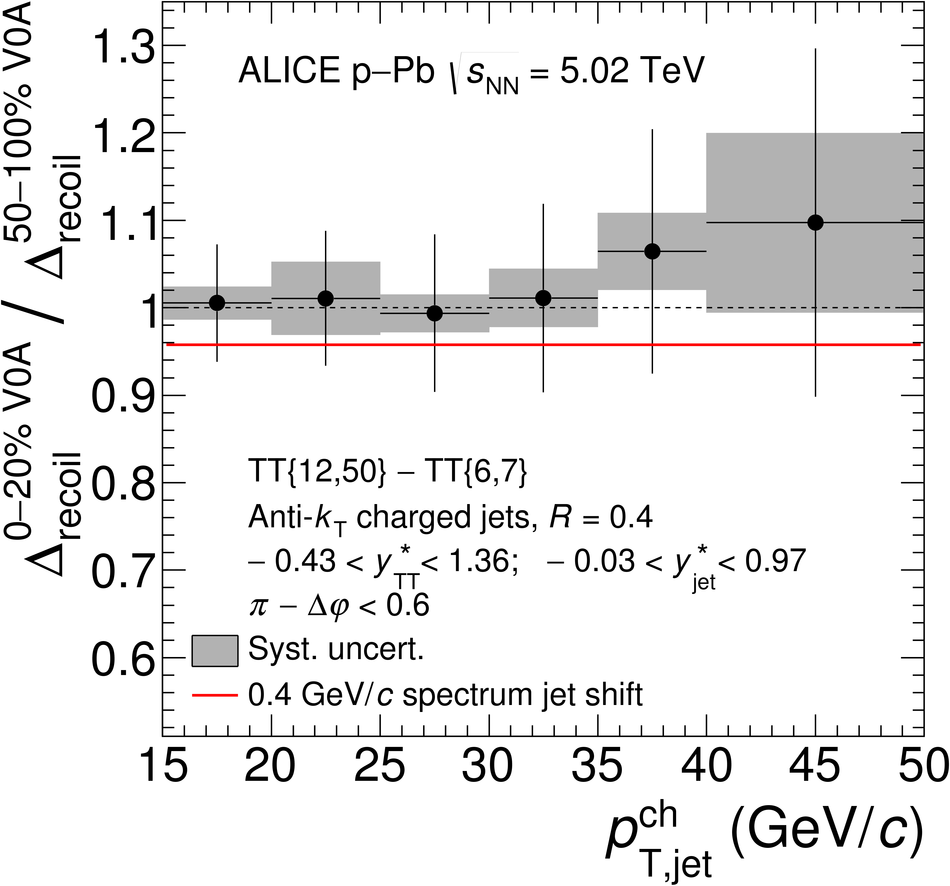 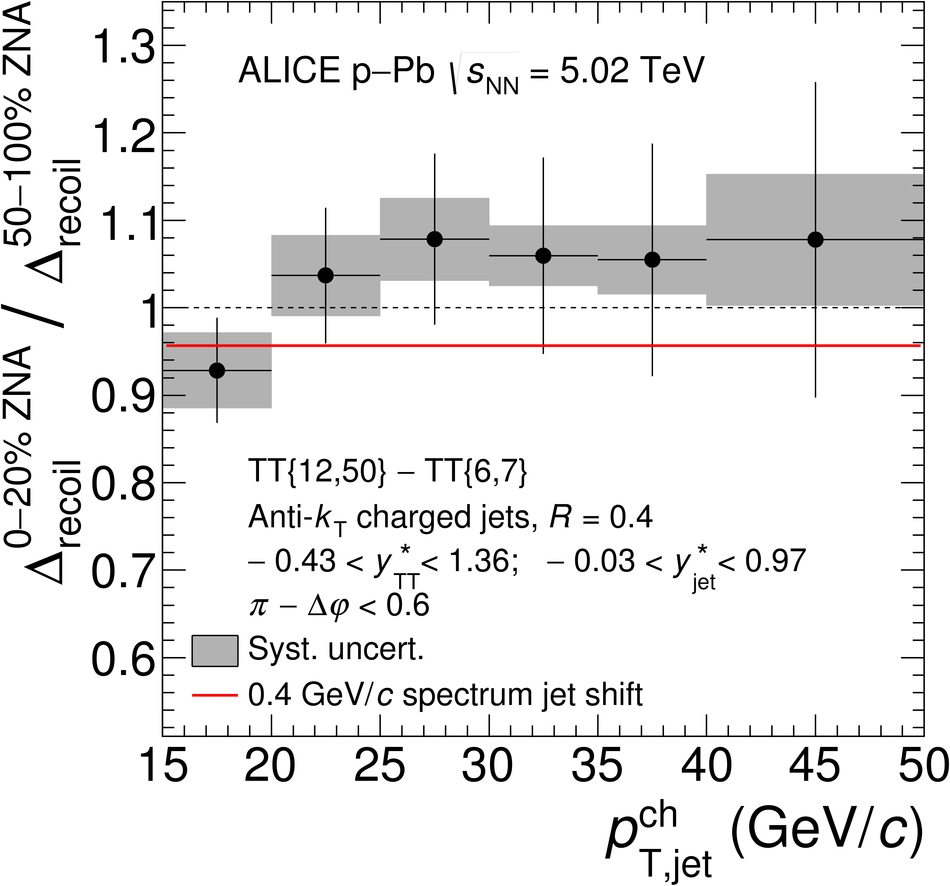 |