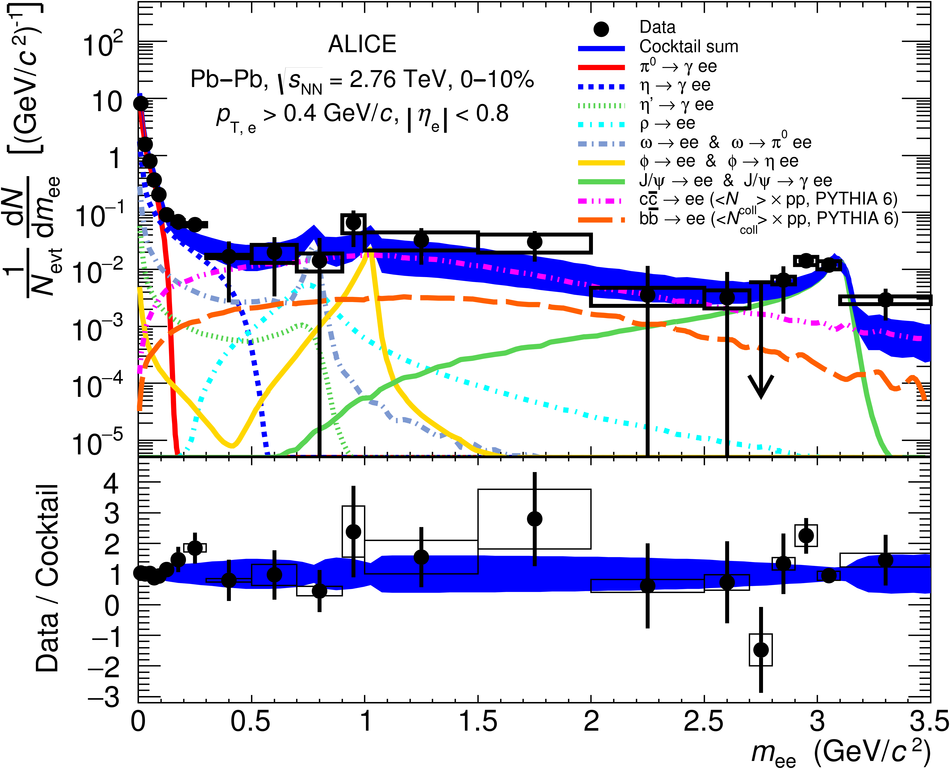
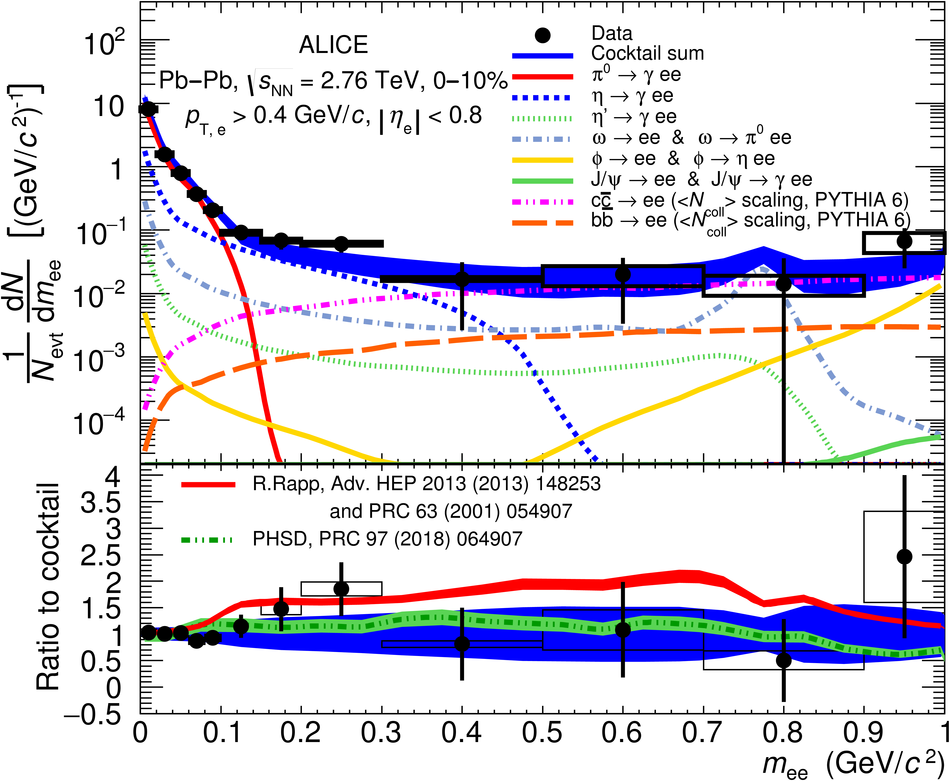
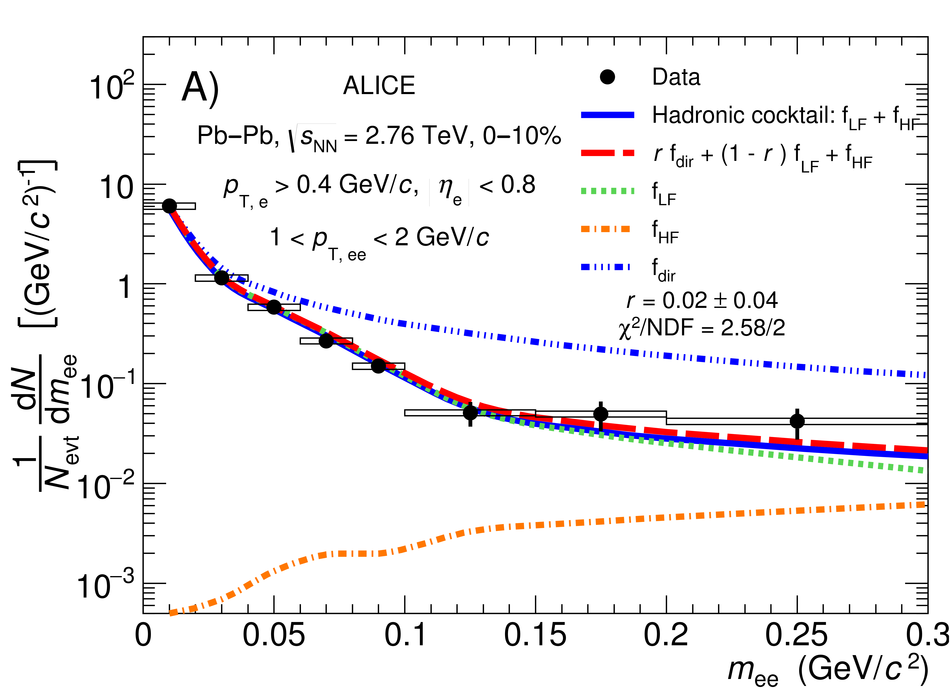
The first measurement of dielectron ($\mathrm{e}^{+}\mathrm{e}^{-}$) production in central (0$-$10$\%$) Pb-Pb collisions at $\mathbf{\sqrt{{\textit{s}}_{\mathrm{NN}}}}$ = 2.76 TeV at the LHC is presented. The dielectron invariant-mass spectrum is compared to the expected contributions from hadron decays in the invariant-mass range $0 <~ m_{\mathrm{ee}}<~3.5\ \mathrm{GeV}/\textit{c}^{2}$. The ratio of data and the cocktail of hadronic contributions without vacuum $\rho^{0}$ is measured in the invariant-mass range $0.15 <~ m_{\mathrm{ee}}<~0.7\ \mathrm{GeV}/\textit{c}^{2}$, where an excess of dielectrons is observed in other experiments, and its value is $1.40 \pm 0.28\ (\mathrm{stat.}) \pm 0.08\ (\mathrm{syst.}) \pm 0.27\ (\mathrm{cocktail})$. The dielectron spectrum measured in the invariant mass range $0 <~ m_{\mathrm{ee}}<~1\ \mathrm{GeV}/\textit{c}^{2}$ is consistent with the predictions from two theoretical model calculations that include thermal dielectron production from both partonic and hadronic phases with in-medium broadened $\rho^{0}$ meson. The fraction of direct virtual photons over inclusive virtual photons is extracted for dielectron pairs with invariant mass $0.1 <~ m_{\mathrm{ee}}<~0.3\ \mathrm{GeV}/\textit{c}^{2}$, and in the transverse-momentum intervals $1<~p_{\mathrm{T}, \mathrm{ee}}<~2\ \mathrm{GeV}/\textit{c}$ and $2<~p_{\mathrm{T}, \mathrm{ee}}<~4\ \mathrm{GeV}/\textit{c}$. The measured fraction of virtual direct photons is consistent with the measurement of real direct photons by ALICE and with the expectations from previous dielectron measurements at RHIC within the experimental uncertainties.
Phys. Rev. C 99, 024002
HEP Data
e-Print: arXiv:1807.00923 | PDF | inSPIRE
Figure 2
. Invariant-mass distribution of correlated electron-hadron and hadron-hadron pairs, where hadrons are wrongly identified as electrons, in comparison with the invariant-mass spectrum of all pairs (dielectron signal pairs and `contaminated' pairs) obtained from MC simulations. In the bottom panel, the ratio between the invariant-mass spectrum of electron-hadron and hadron-hadron pairs to that of all pairs is shown. Boxes represent the systematic uncertainties on the hadron contamination. | 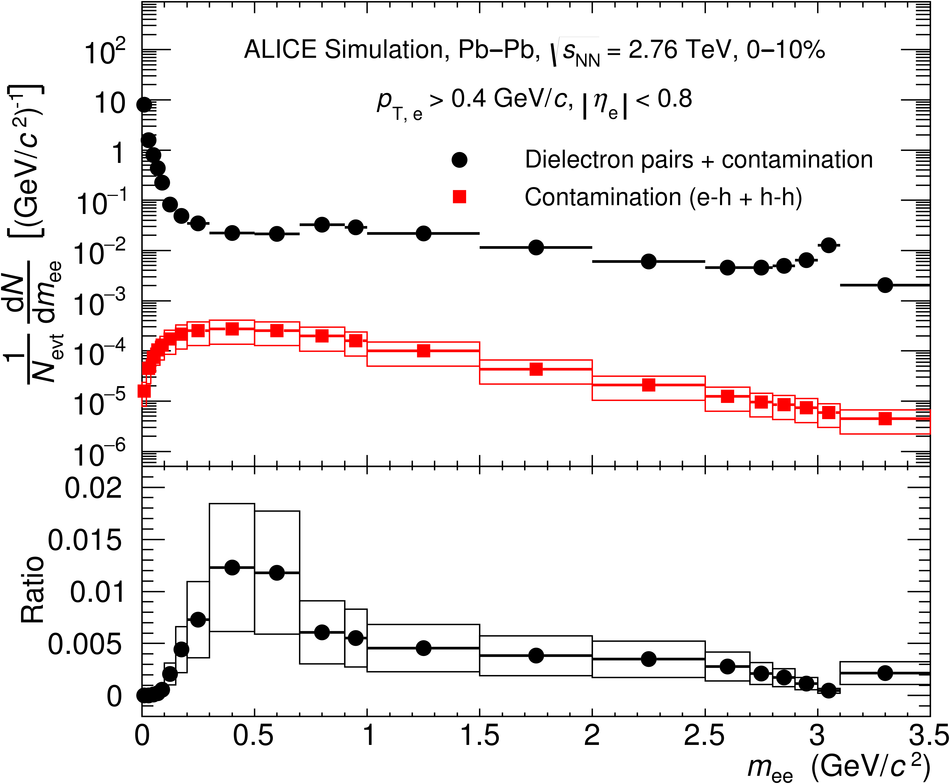 |
Figure 4
. (A) $\psi_{\mathrm{V}}$ distribution for correlated $\mathrm{e}^{+}\mathrm{e}^{-}$ pairs originating from different dielectron sources. (B) Correlation between $\psi_{\mathrm{V}}$ and $m_{\mathrm{ee}}$ for electron-positron pairs produced by photon conversion in the detector material. Their tracks have passed the single-track conversion rejection. The regions used to select the conversion pair candidates are indicated by the red boxes. | 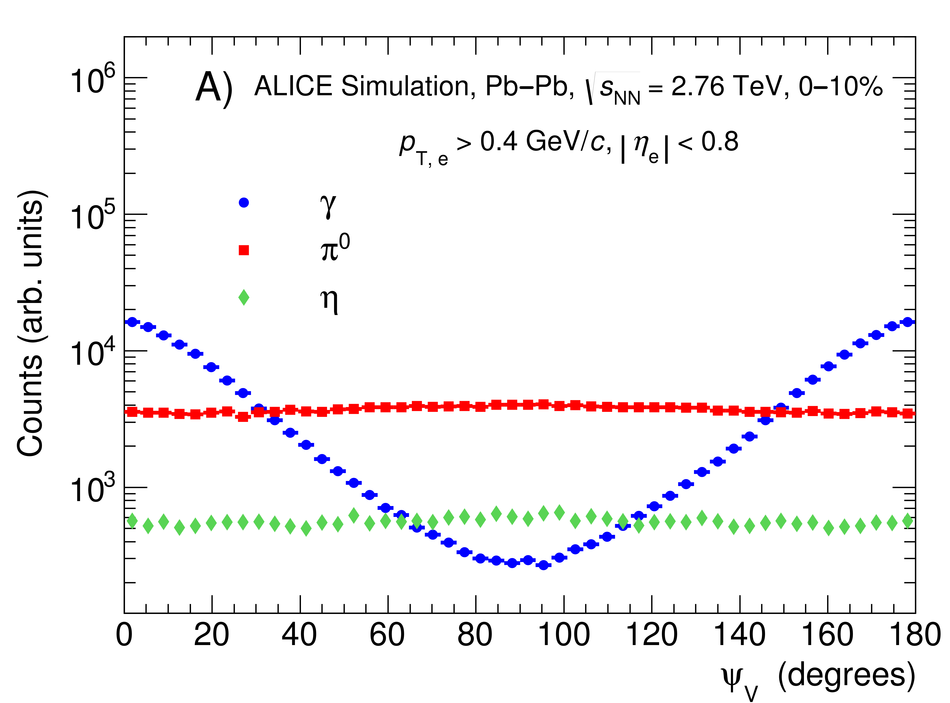 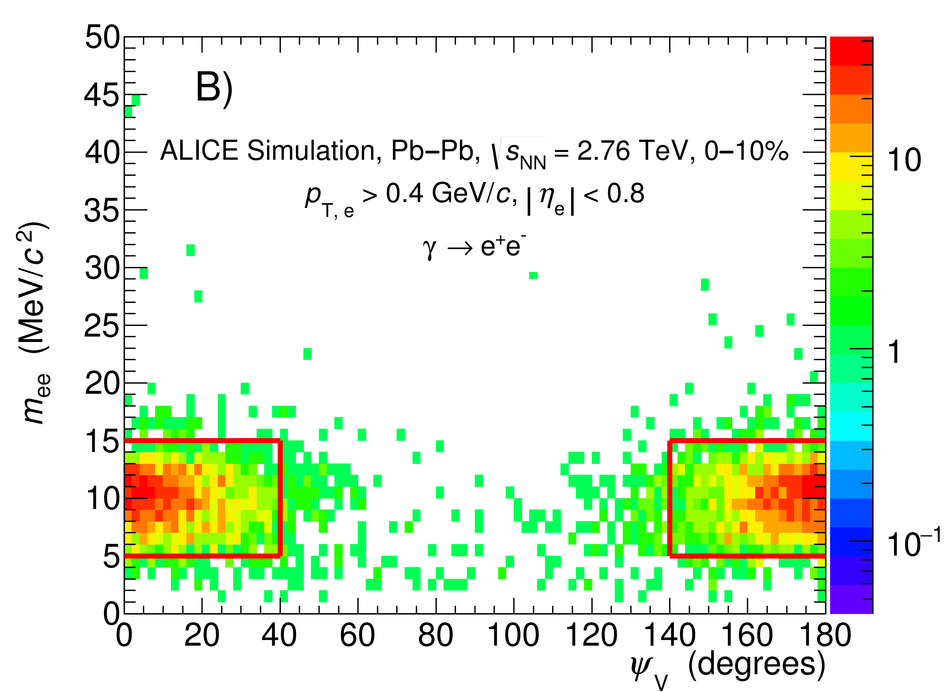 |
Figure 5
. (A) Rejection efficiency of conversion electrons as a function of $p_{\mathrm{T}, \mathrm{e}}$ using single-track rejection, pair rejection and using both methods. (B) Fraction of signal tracks rejected by the conversion rejection methods as a function of $p_{\mathrm{T}, \mathrm{e}}$. | 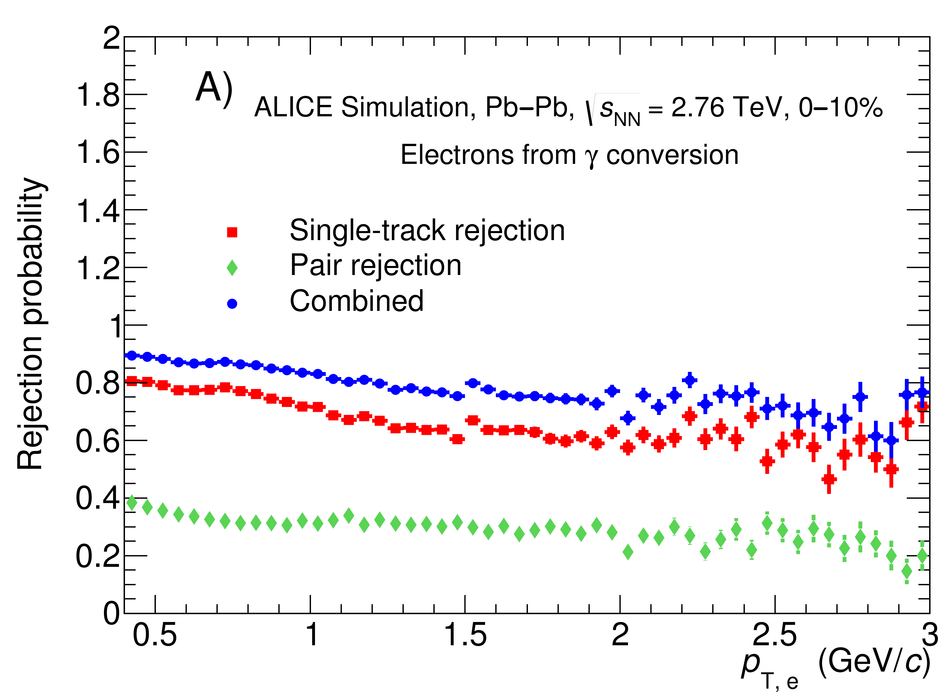  |
Figure 6
. (A) Dielectron raw yield, in the low-mass region, in comparison with the residual contribution of conversion electrons, estimated using MC simulations. (B) Relative contribution to the dielectron spectrum of conversion electrons surviving the photon conversion rejection. Only results for the negative magnetic field polarity are shown, with similar values obtained for the positive magnetic field configuration. |  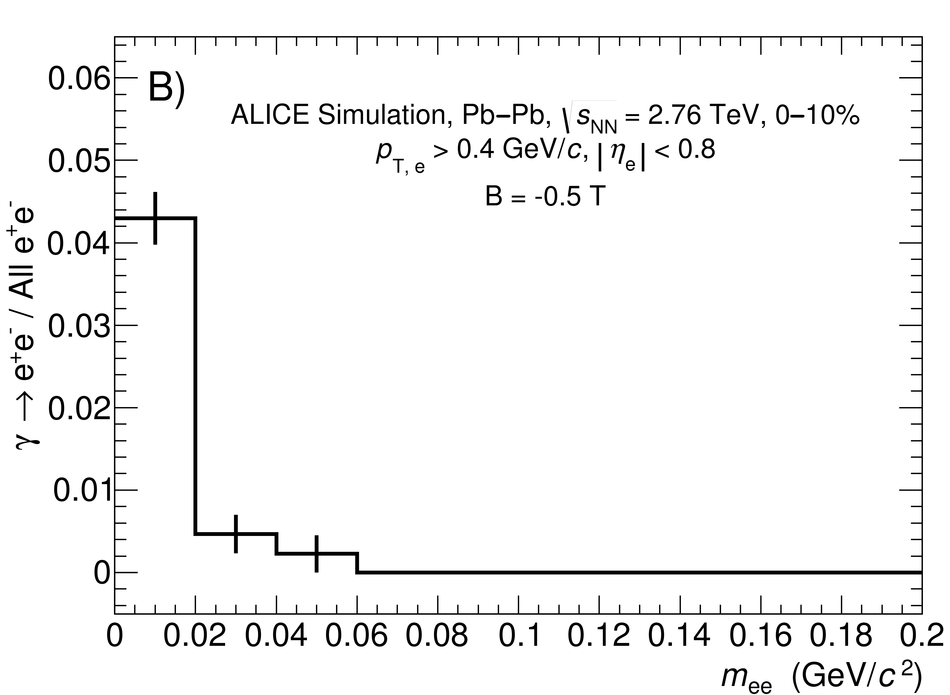 |
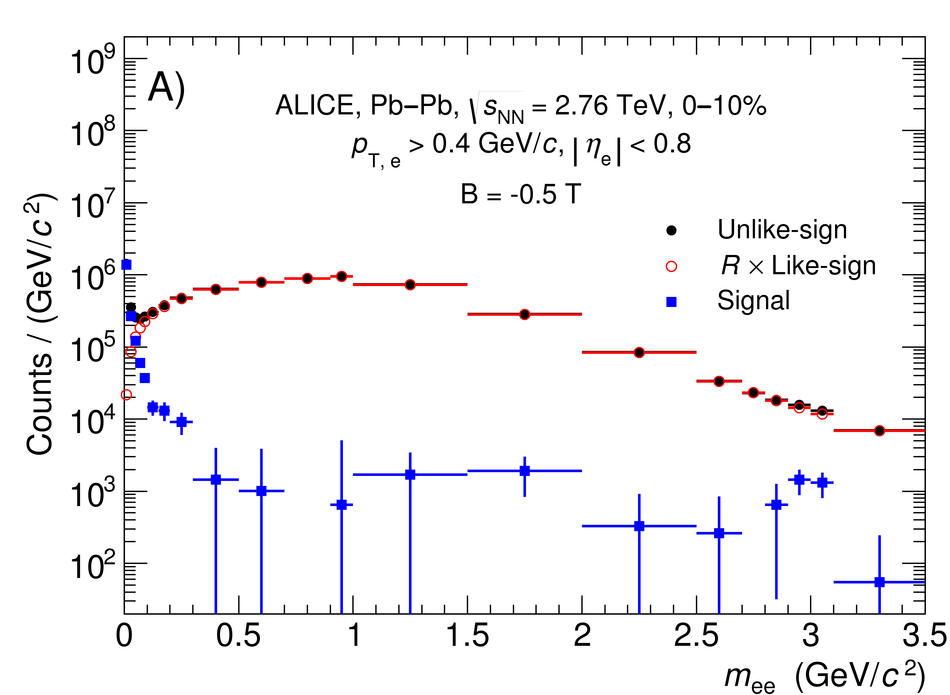
Figure 9
. Reconstruction efficiency of dielectrons as a function of the invariant mass for different $p_{\mathrm{T}, \mathrm{ee}}$ intervals. The statistical uncertainties are represented by the vertical bars. Only results for the negative magnetic field polarity are shown, with similar values obtained for the positive magnetic field configuration. | 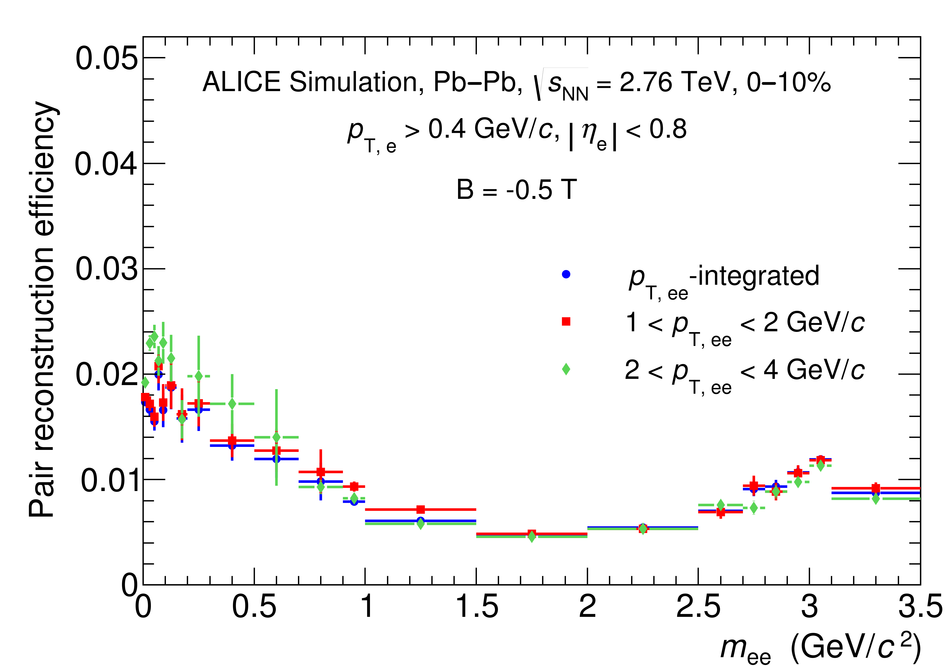 |