The measurement of the production of prompt D$^0$, D$^+$, D$^{*+}$, and D$^+_s$ mesons in proton$-$lead (p$-$Pb) collisions at the centre-of-mass energy per nucleon pair of $\sqrt{s_{\rm NN}}$ = 5.02 TeV, with an integrated luminosity of $292\pm 11$ $\mu$b$^{-1}$, are reported. Differential production cross sections are measured at mid-rapidity ($-0.96<~y_{\rm cms}<~0.04$) as a function of transverse momentum ($p_{\rm T}$) in the intervals $0<~ p_{\rm T} <~ 36$ GeV/$c$ for D$^0$, $1<~ p_{\rm T} <~36$ GeV/$c$ for D$^+$ and D$^{*+}$, and $2<~ p_{\rm T} <~24$ GeV/$c$ for D$^+_s$ mesons. For each species, the nuclear modification factor $R_{\rm pPb}$ is calculated as a function of $p_{\rm T}$ using a proton-proton (pp) reference measured at the same collision energy. The results are compatible with unity in the whole $p_{\rm T}$ range. The average of the non-strange D mesons $R_{\rm pPb}$ is compared with theoretical model predictions that include initial-state effects and parton transport model predictions. The $p_{\rm T}$ dependence of the D$^0$, D$^+$, and D$^{*+}$ nuclear modification factors is also reported in the interval $1<~ p_{\rm T} <~ 36$ GeV/$c$ as a function of the collision centrality, and the central-to-peripheral ratios are computed from the D-meson yields measured in different centrality classes. The results are further compared with charged-particle measurements and a similar trend is observed in all the centrality classes. The ratios of the $p_{\rm T}$-differential cross sections of D$^0$, D$^+$, D$^{*+}$, and D$^+_s$ mesons are also reported. The D$^+_s$ and D$^+$ yields are compared as a function of the charged-particle multiplicity for several $p_{\rm T}$ intervals. No modification in the relative abundances of the four species is observed with respect to pp collisions within the statistical and systematic uncertainties.
JHEP 2019 (2019) 92
HEP Data
e-Print: arXiv:1906.03425 | PDF | inSPIRE
CERN-EP-2019-125
Figure 1
Examplary invariant-mass distributions for $\Dzero$, $\Dplus$, and $\Ds$ candidates (plus charge conjugates) and the mass difference $\Delta M = M_{{\rm K} \pi\pi} -M_{{\rm K} \pi}$ for $\Dstar$ candidates (and charge conjugates) in minimum-bias p--Pb collisions at $\sqrtsNN=5.02 \tev$ The dashed curves represent the fit applied to the background, while the solid lines represent the total fit function In the case of the $\Dzero$ meson, the contribution of signal reflections in the invariant-mass distribution is shown using a gray dot-dashed line. In the case of the $\Ds$ invariant-mass distribution, an additional Gaussian is used in the fit function in order to describe the $\Dplus$ signal peak on the left side of the $\Ds$ signal. | 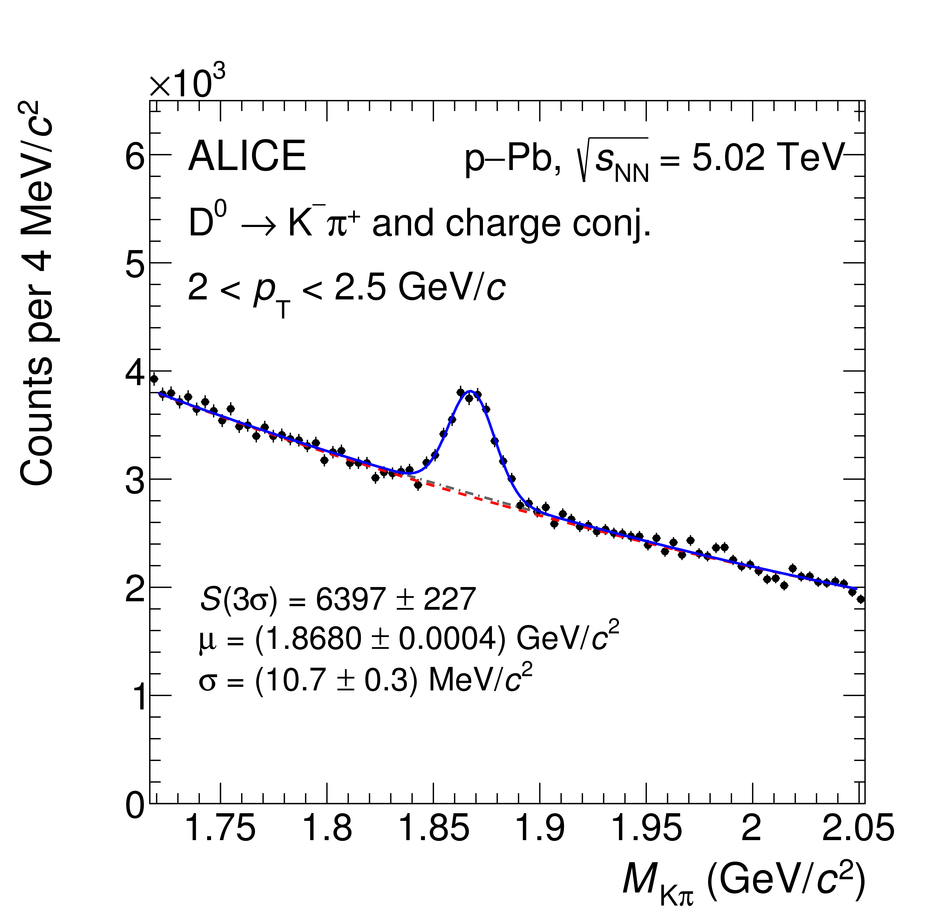 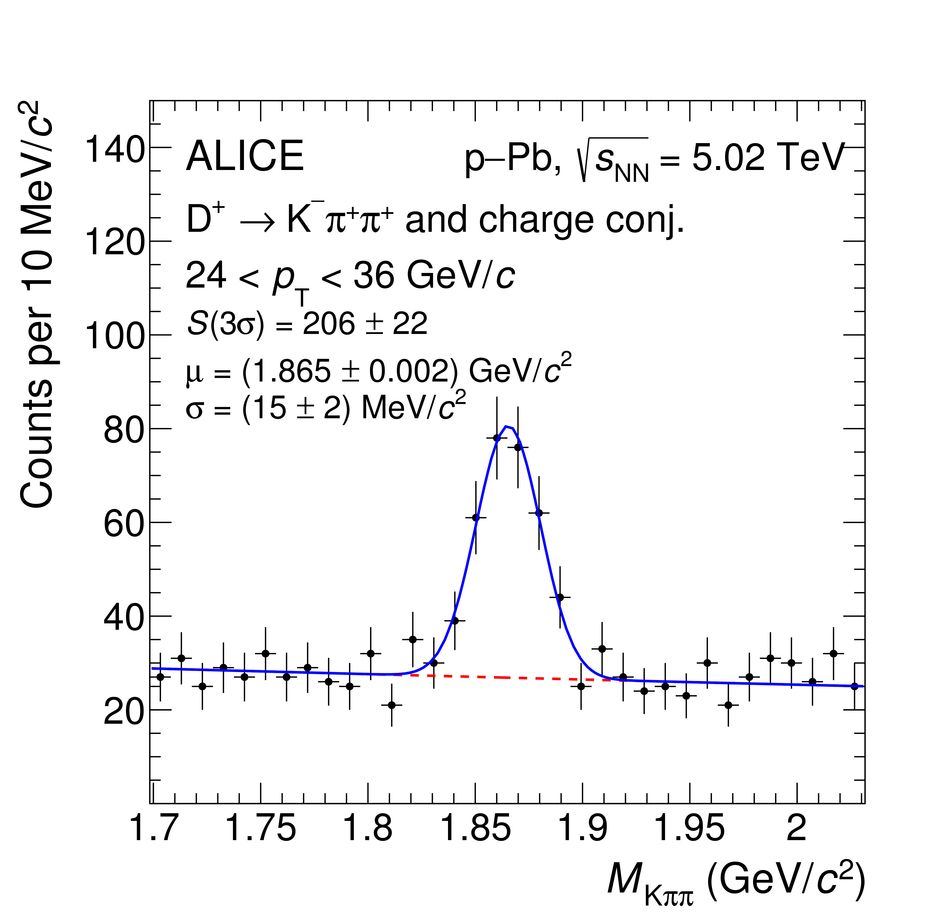 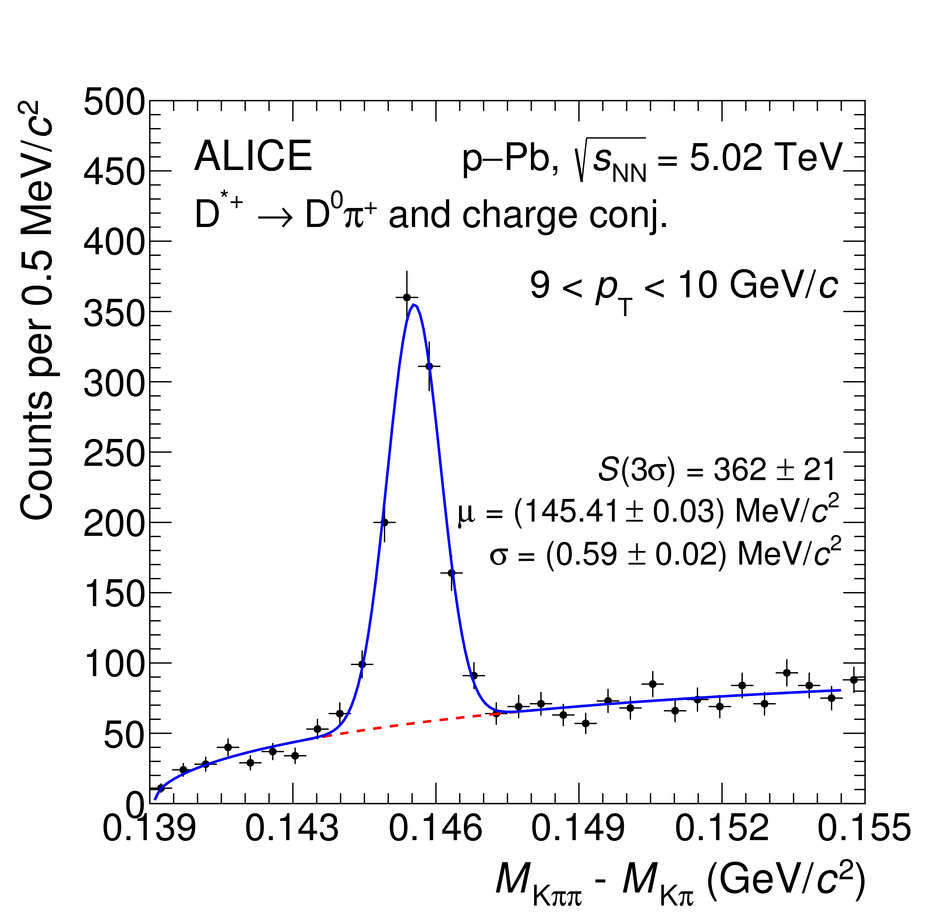 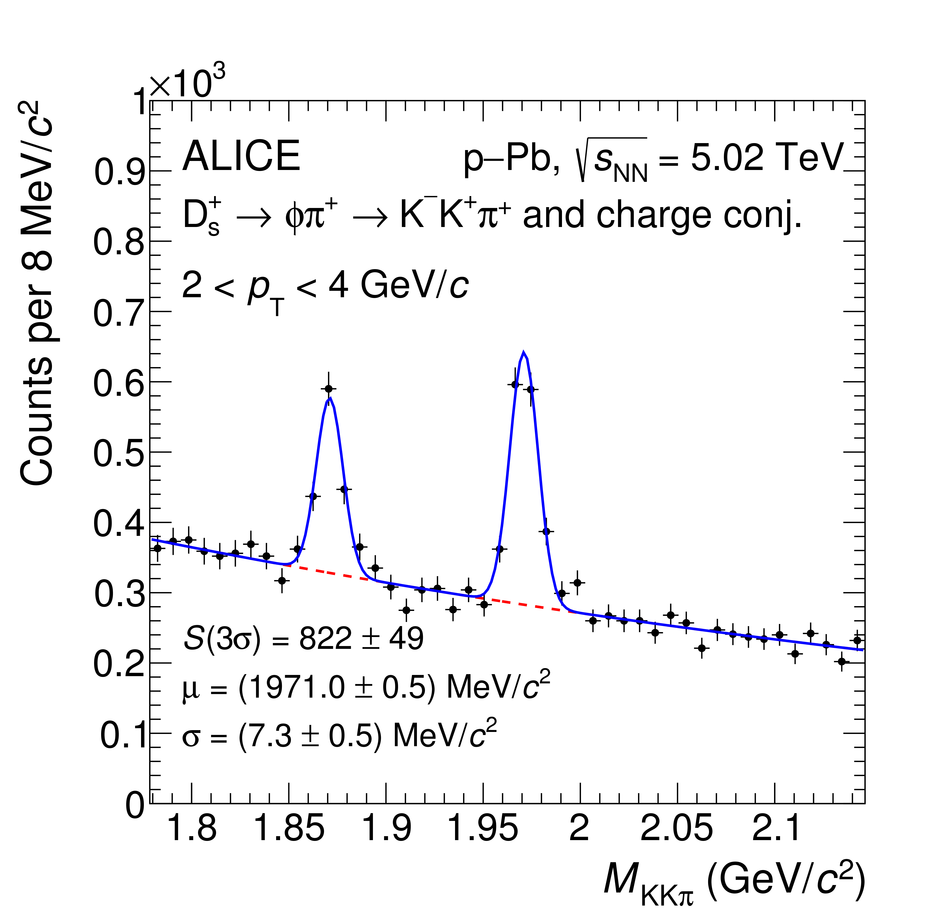 |
Figure 2
The product of acceptance and efficiency for $\Dzero$, $\Dplus$, $\Dstar$, and $\Ds$ mesons as a function of transverse momentum in p--Pb collisions at $\sqrtsNN=5.02 \tev$ The values for prompt (solid line) and feed-down (dashed line) D mesons are shown | 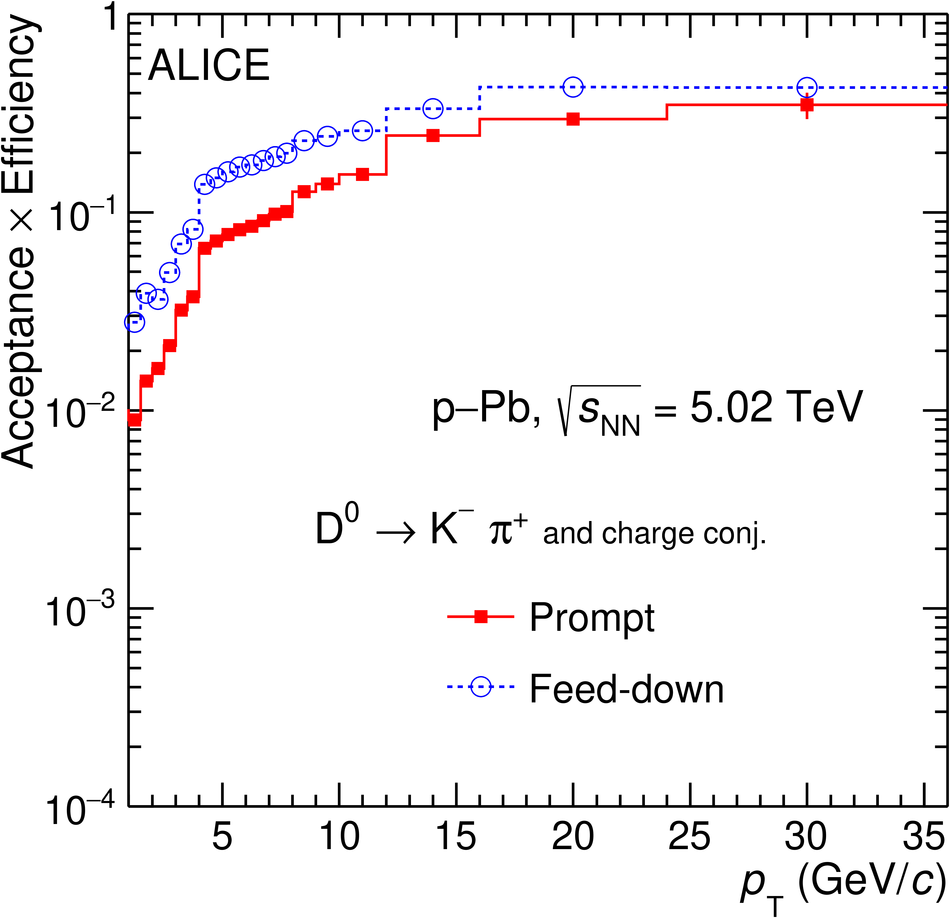 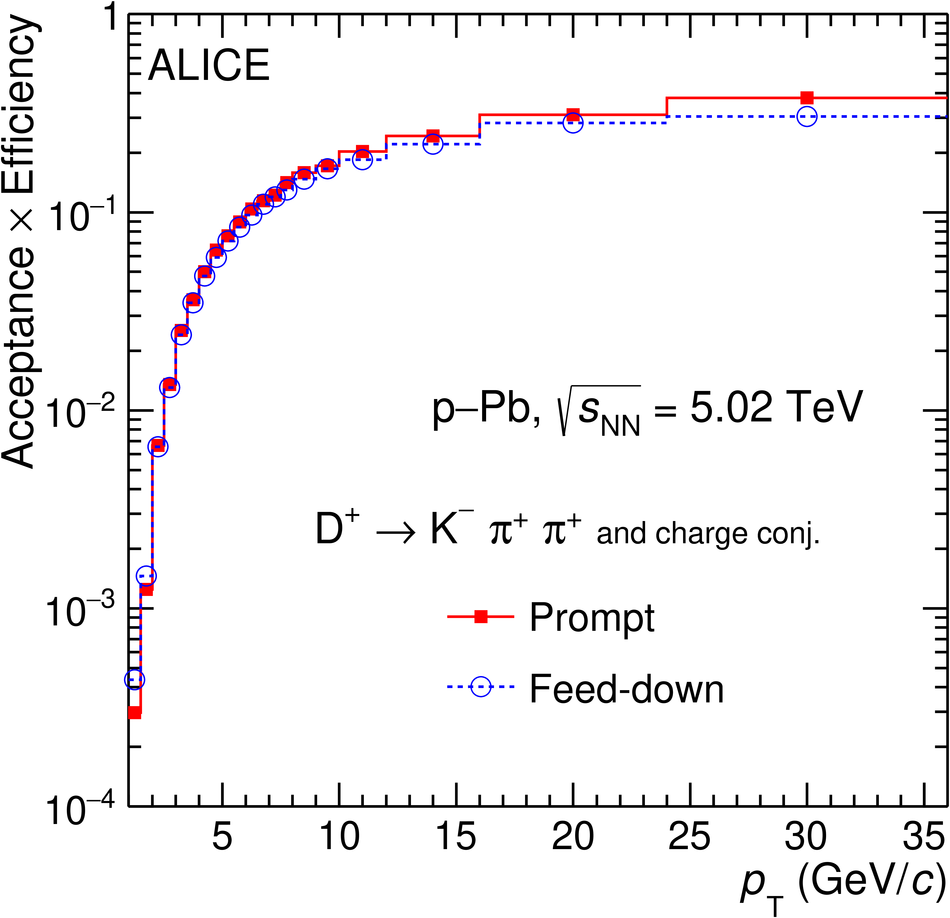 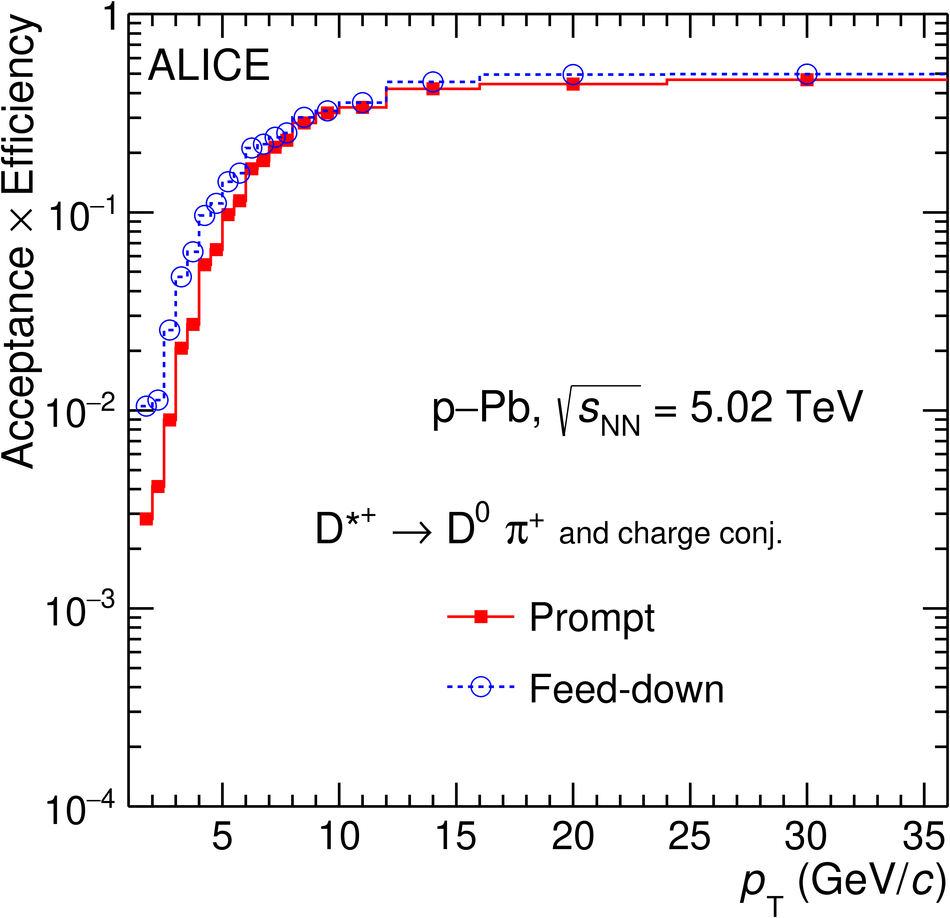 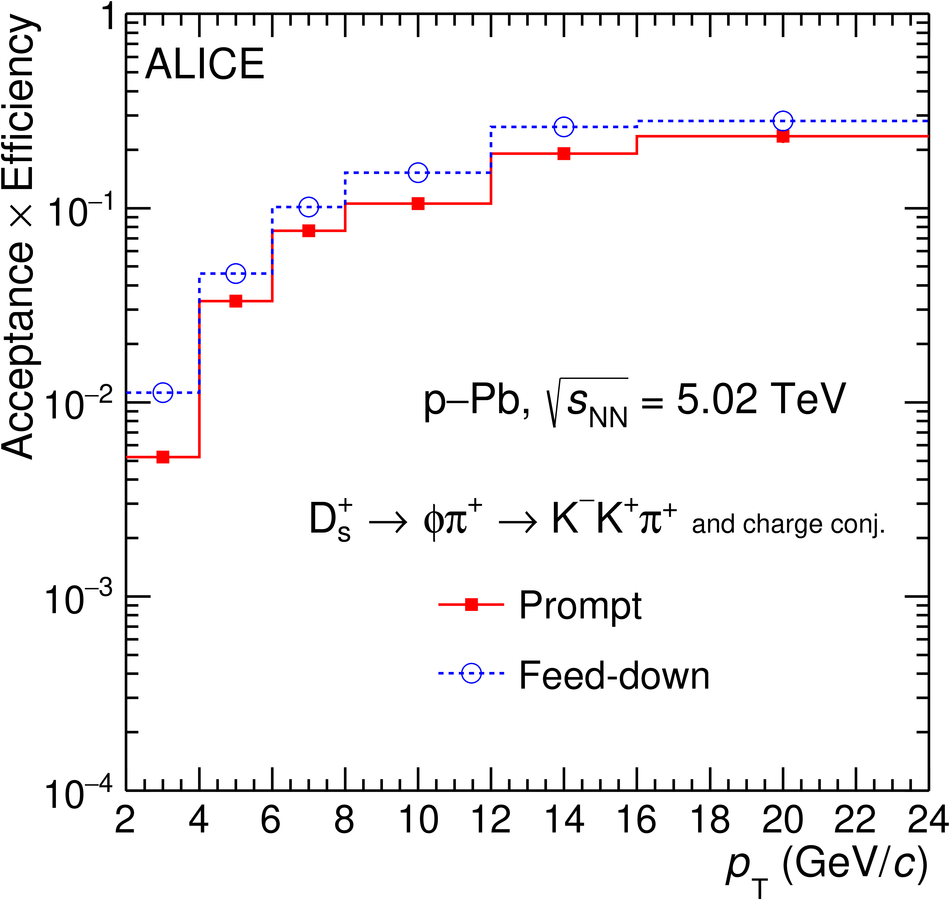 |
Figure 3
Invariant-mass distributions of $\DtoKpi$ candidates (andcharge conjugates) for $0< \pt< 1 \gev/c$. The left panel displaysthe invariant-mass distribution of all ULS K$\pi$ pairs together with thebackground distribution estimated with the track-rotation technique. The right panel shows the invariant-mass distribution after subtracting the background estimated with the track-rotation technique. The fit function is superimposed. | 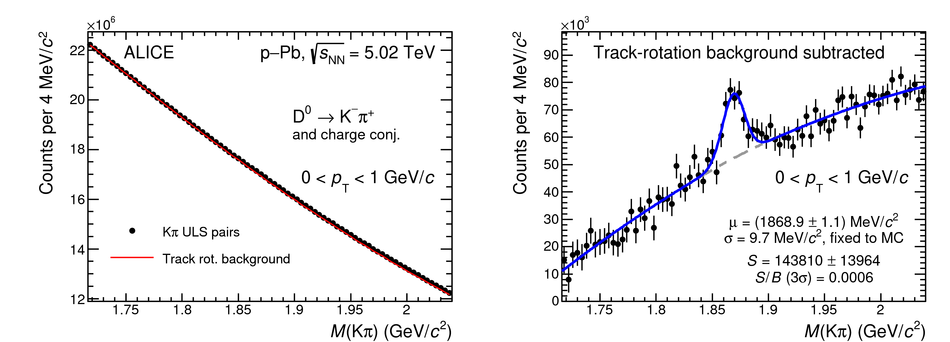 |
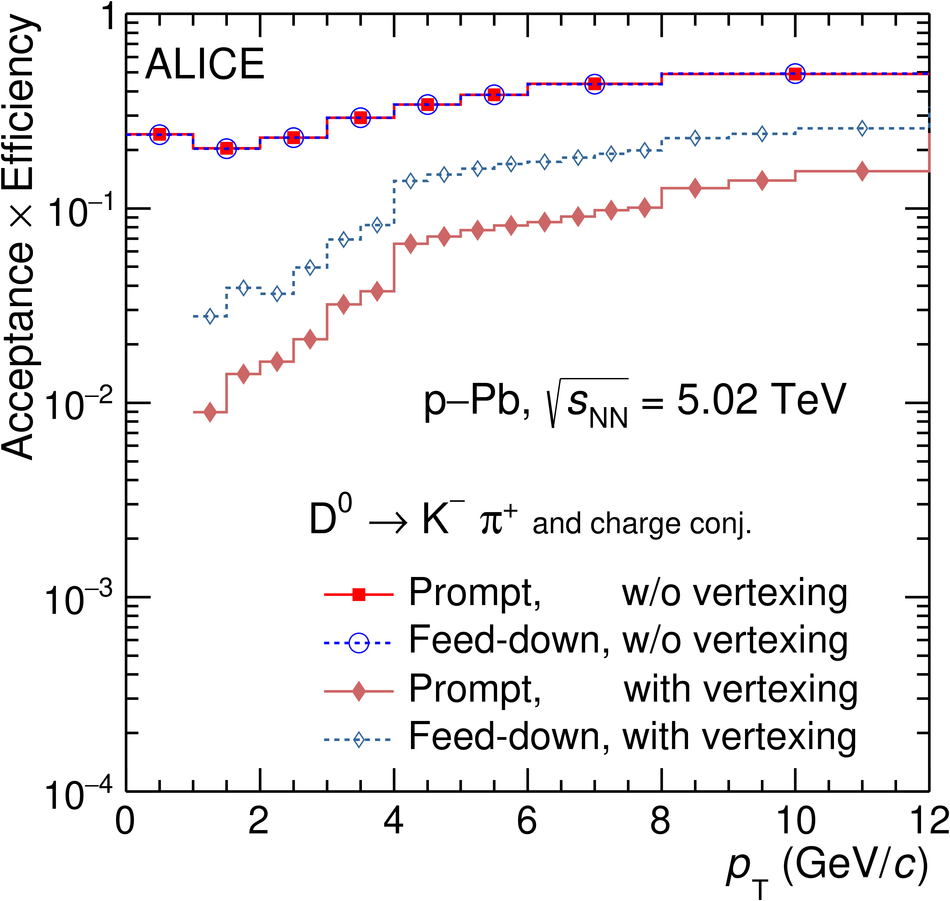
Figure 5
Left: Exemplary fits to the impact-parameter distributions of $\Dzero$, $\Dplus$, and $\Dstar$ candidates. The curves show the fit functions describing the prompt, feed-down, and background contributions as well as their sum, as described in the text Right: fraction of prompt $\Dzero$, $\Dplus$, and $\Dstar$ raw yield as a function of transverse momentum $\pt$ compared with the values obtained with the FONLL-based approach. The results from the data-driven method are shown as square markers with the error bars (boxes) representing the statistical (systematic) uncertainty. The central values of $\fprompt$ from the FONLL-based approach are shown as the dashed lines and the uncertainty as red boxes |  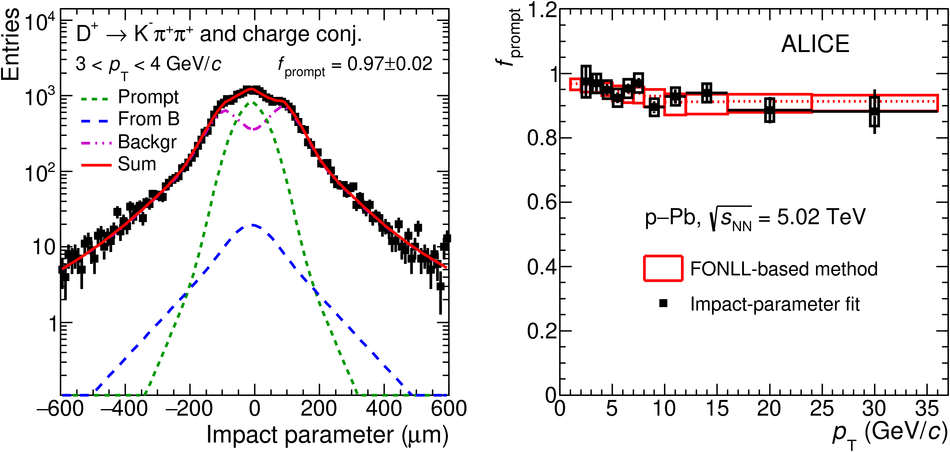 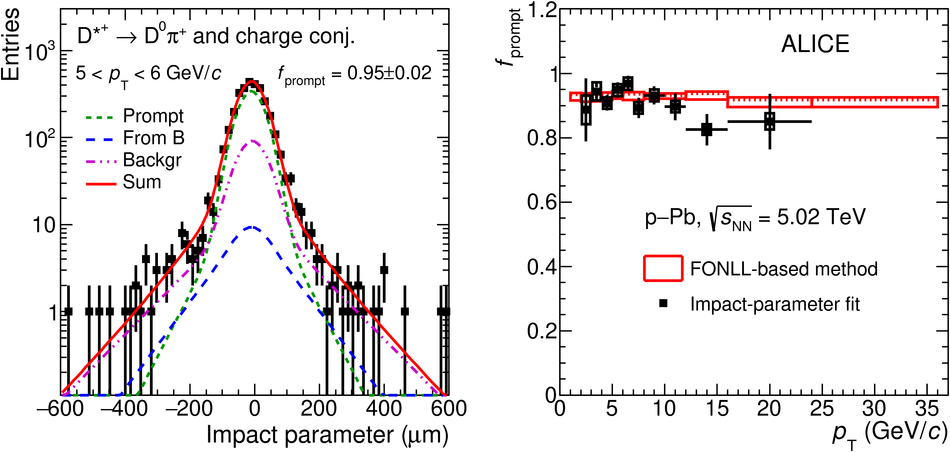 |
Figure 6
Left: inclusive $\Dzero$-meson production cross sections from the analysis without decay-vertex reconstruction in p--Pb collisions and pp collisions, both at $\sqrtsNN =5.02 \tev$. The cross section measured in pp collision is scaled by the Pb mass number ($A=208$) and corrected for the rapidity shift in p--Pb collisions using FONLL calculations. Right: $\pt$-differential production cross section of prompt $\Dzero$ mesons with $-0.96< y_{\rm cms}< 0.04$ in p--Pb collisions at $\sqrtsNN =5.02 \tev$, measured with and without decay-vertex reconstruction. The vertical bars and the empty boxes represent the statistical and systematic uncertainties. The inset shows the ratio of the measurements in their common $\pt$ range | 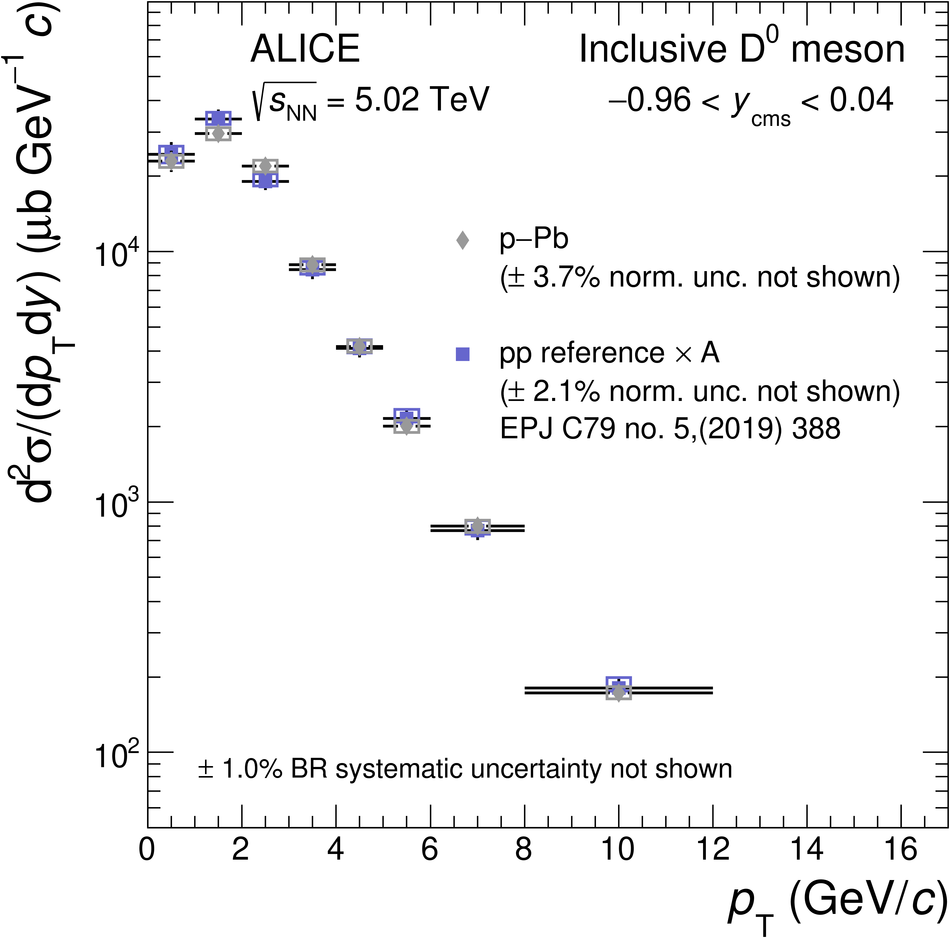 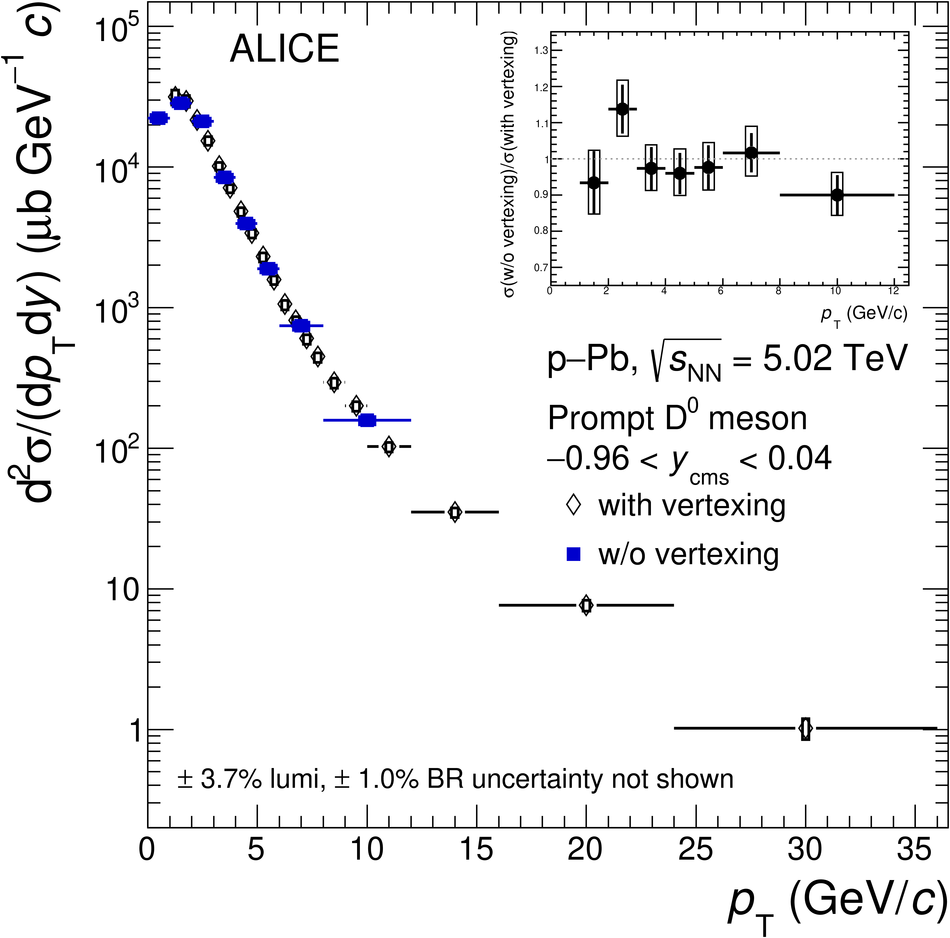 |
Figure 7
$\pt$-differential production cross sections of prompt $\Dzero$, $\Dplus$, $\Dstar$, and $\Ds$ mesons with $-0.96< y_{\rm cms}< 0.04$ in p--Pb collisions at $\sqrtsNN=5.02 \tev$ compared with the respective pp reference cross sections scaled by the Pb mass number ($A=208$) and corrected for the rapidity shift. For the $\Dzero$ meson, the results in the range $0< \pt< 1 \gev/c$ are obtained from the analysis that was performed without decay-vertex reconstruction, while those in the range \mbox{$1< \pt< 36 \gev/c$} are taken from the analysis with decay-vertex reconstruction The vertical bars and the empty boxes represent the statistical and systematic uncertainties | 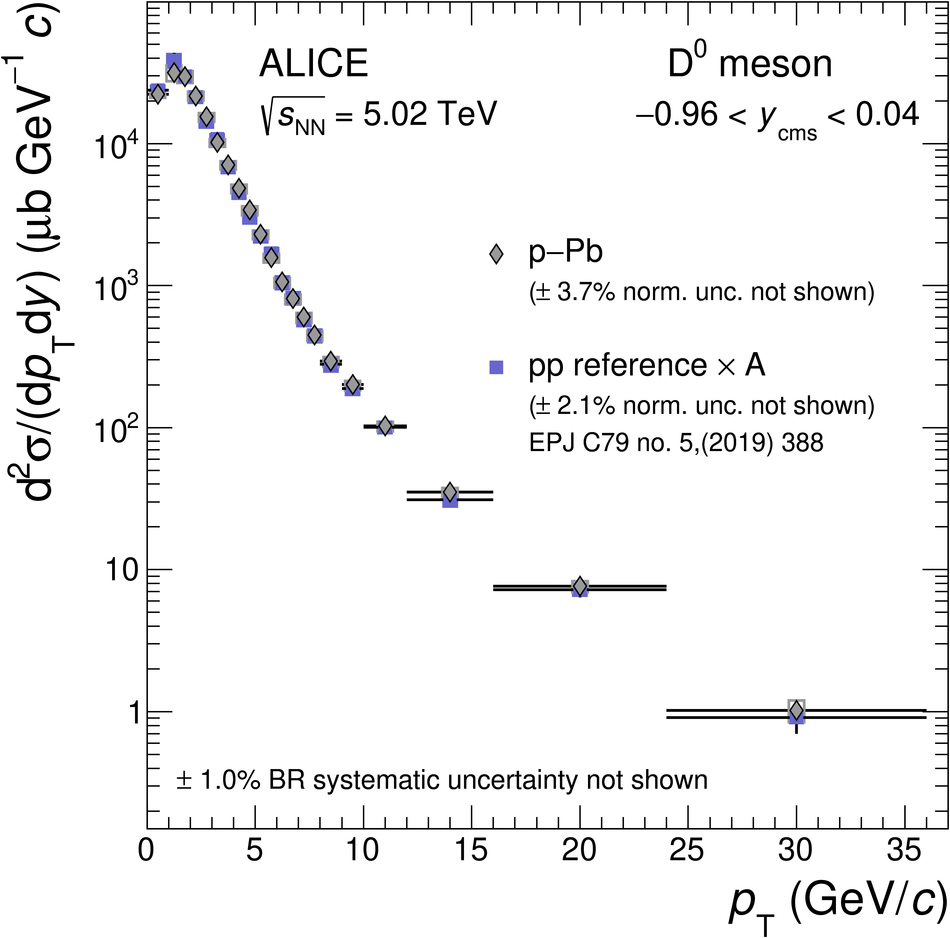 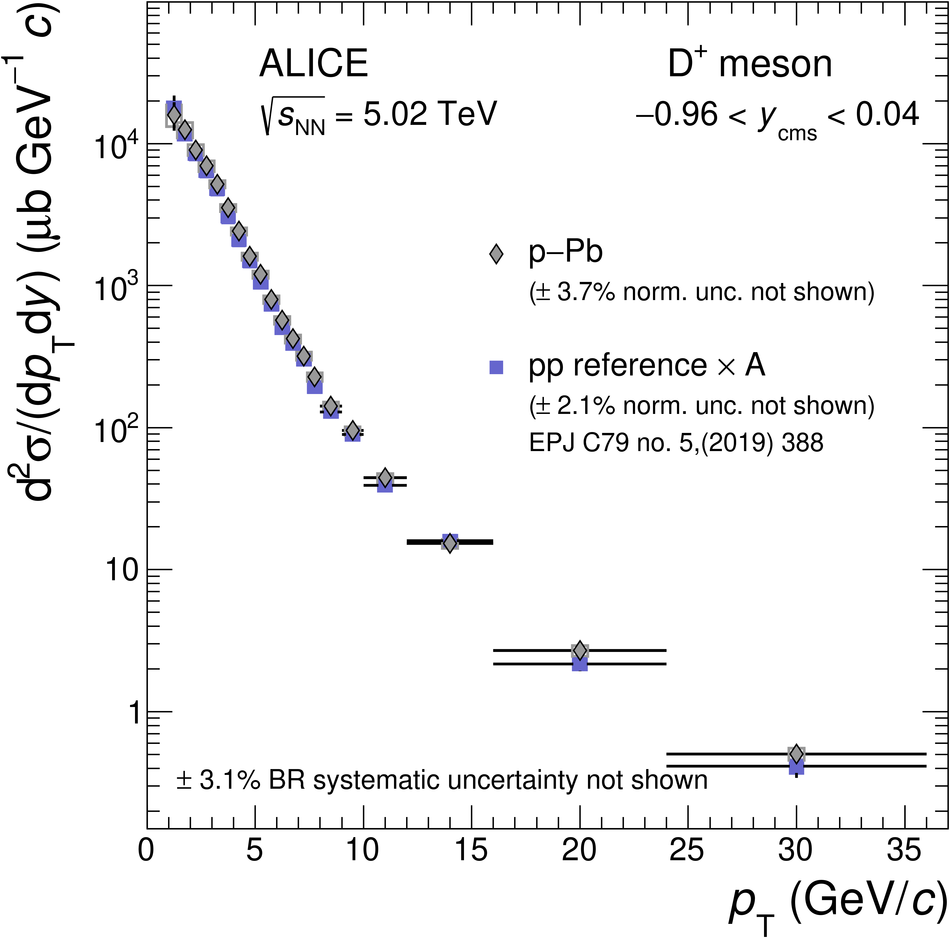 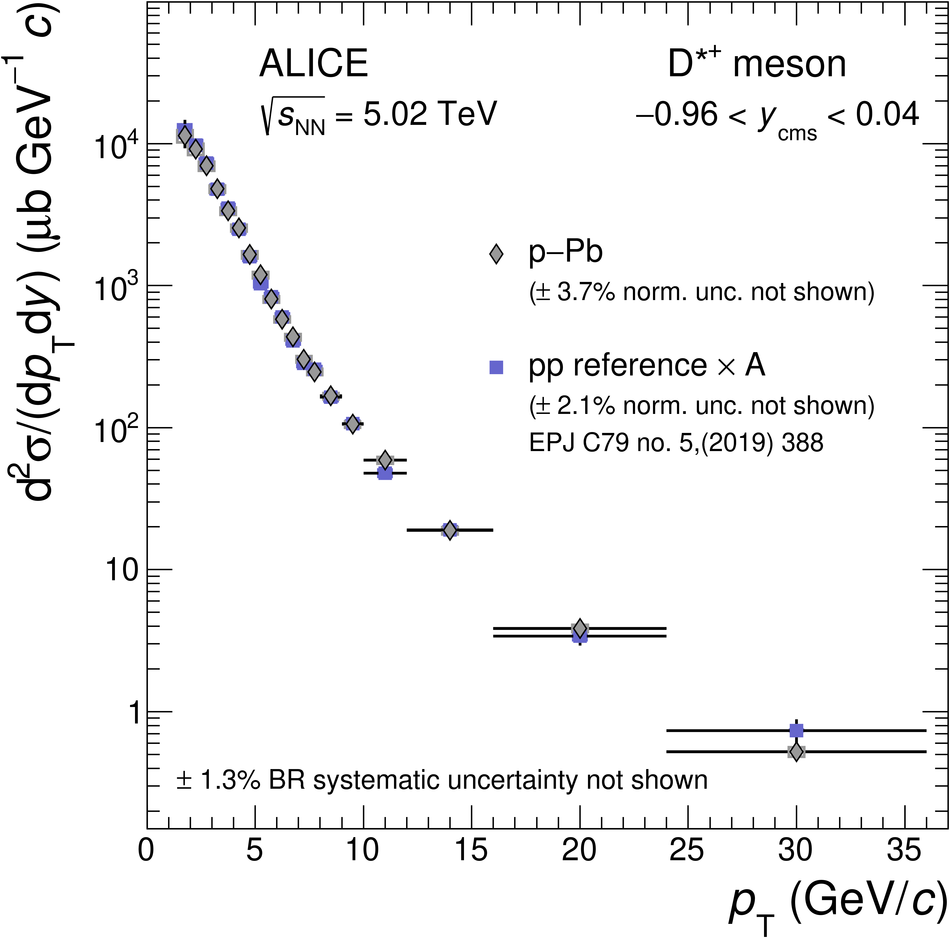 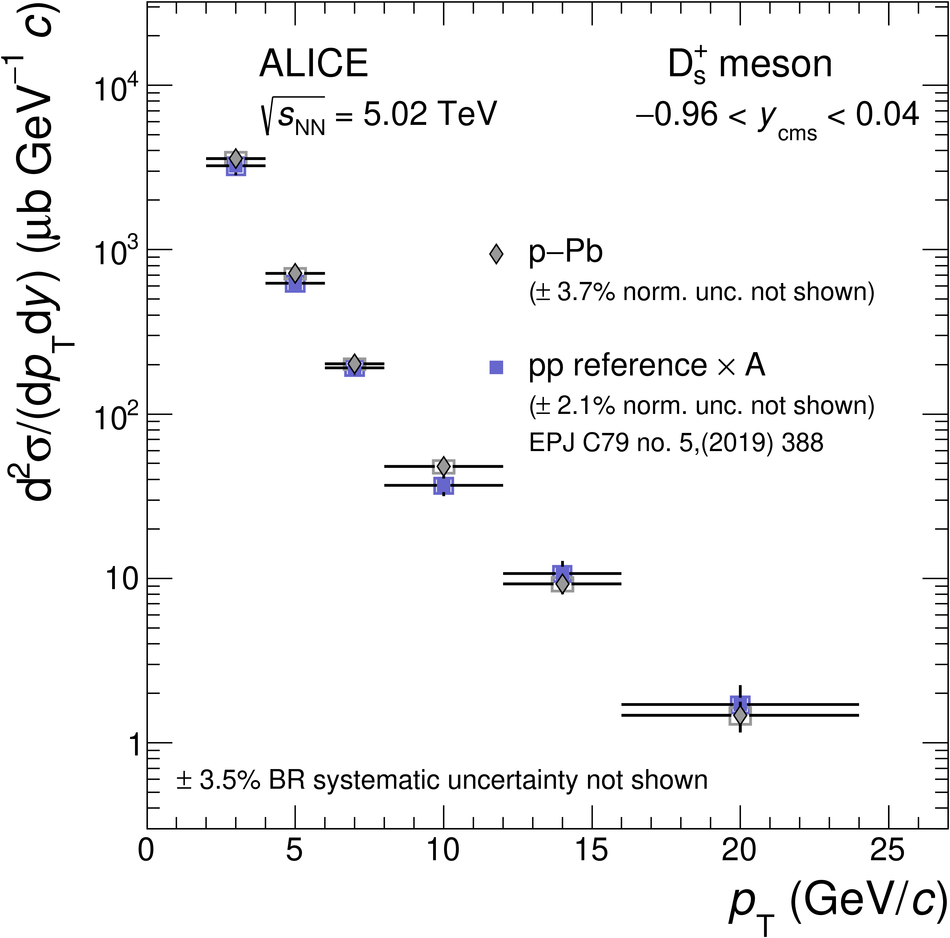 |
Figure 8
Nuclear modification factors $\RpPb$ of prompt D mesons in p--Pb collisions at $\sqrtsNN=5.02 \tev$ Left: $\RpPb$ of $\Dzero$, $\Dplus$, and $\Dstar$ mesons. Right: average $\RpPb$ of non-strange D-meson species in the interval $1< \pt< 36 \gev/c$ , shown together with the $\Dzero$ $R_{\rm pPb}$ in $0< \pt< 1 \GeV/c$ and the $\RpPb$ of $\Ds$ mesons in the interval $2< \pt< 24 \gev/c$ The vertical bars and the empty boxes represent the statistical and systematic uncertainties The black-filled box at $\RpPb=1$ represents the normalisation uncertainty. | 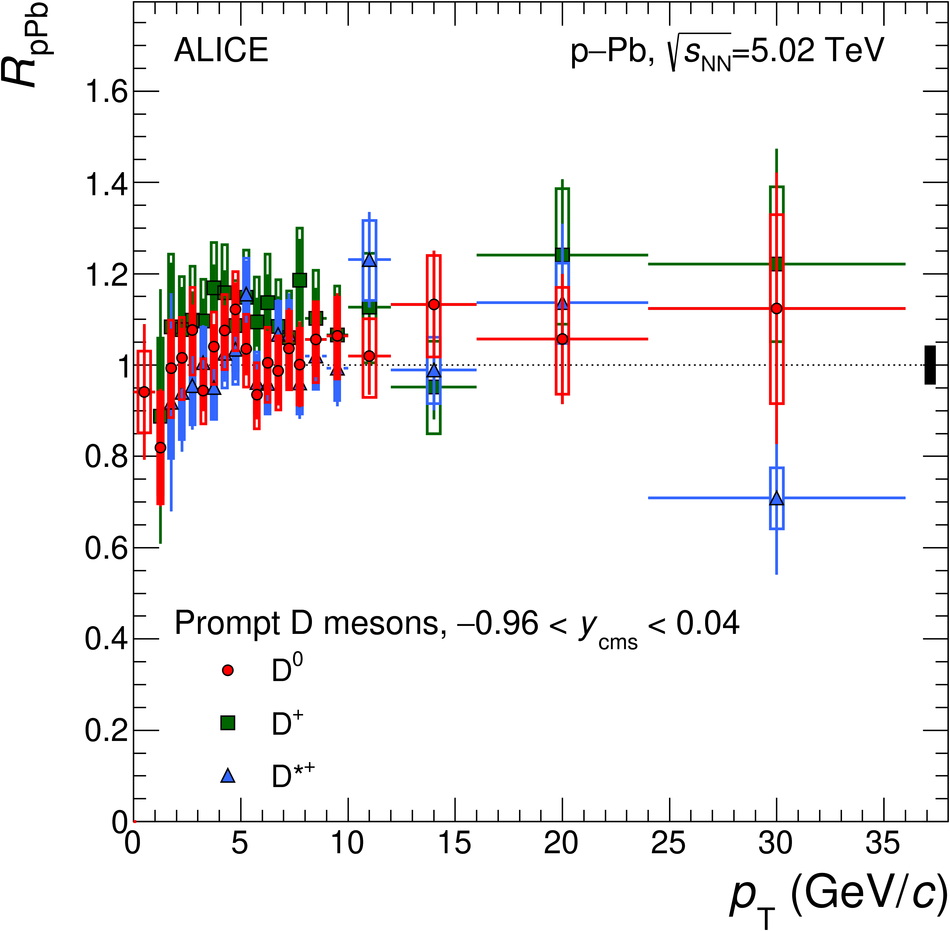 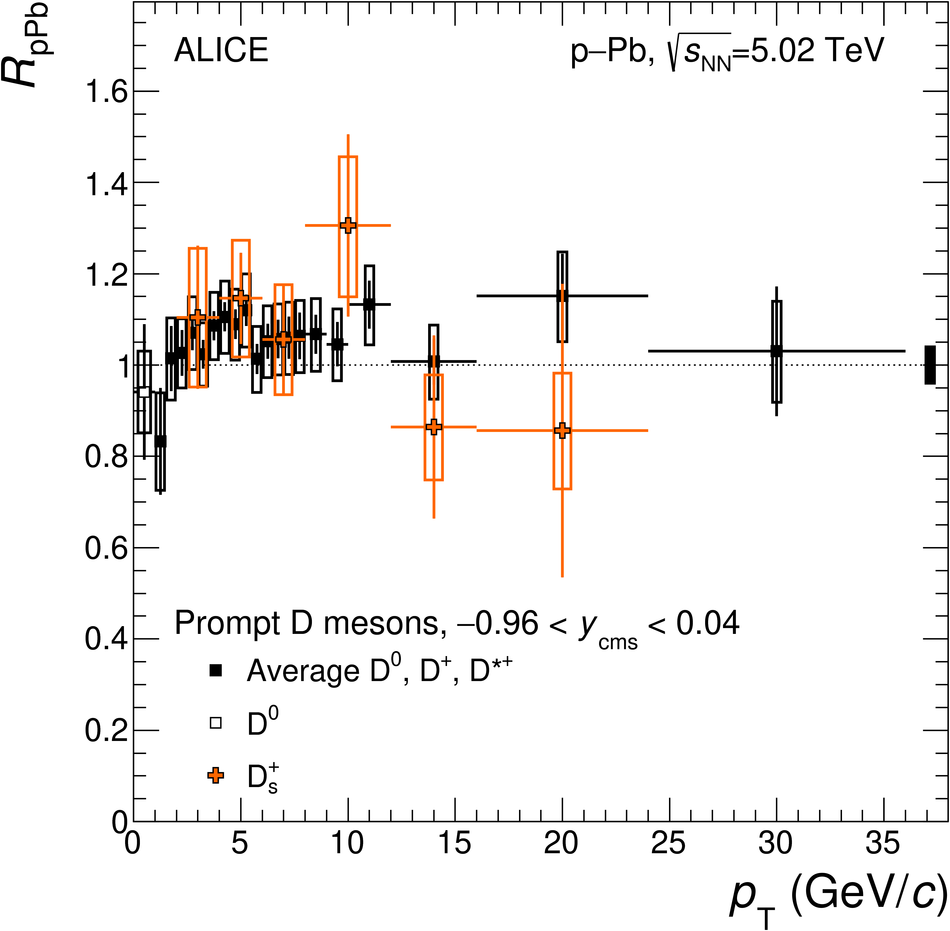 |
Figure 9
Nuclear modification factor $\RpPb$ of prompt non-strange D mesons in p--Pb collisions at $\sqrtsNN=5.02 \tev$. In the left panel, the data are compared with calculations of theoretical models that include only CNM effects: CGC , FONLL with EPPS16 nPDFs , a LO pQCD calculation (Vitev et al.) , and a calculation based on incoherent multiple scatterings (Kang et al.) . In the right panel, the predictions of the Duke and POWLANG transport models are compared with the measured D-meson $\RpPb$ The vertical bars and the empty boxes represent the statistical and systematic uncertainties The black-filled box at $\RpPb=1$ represents the normalisation uncertainty. | 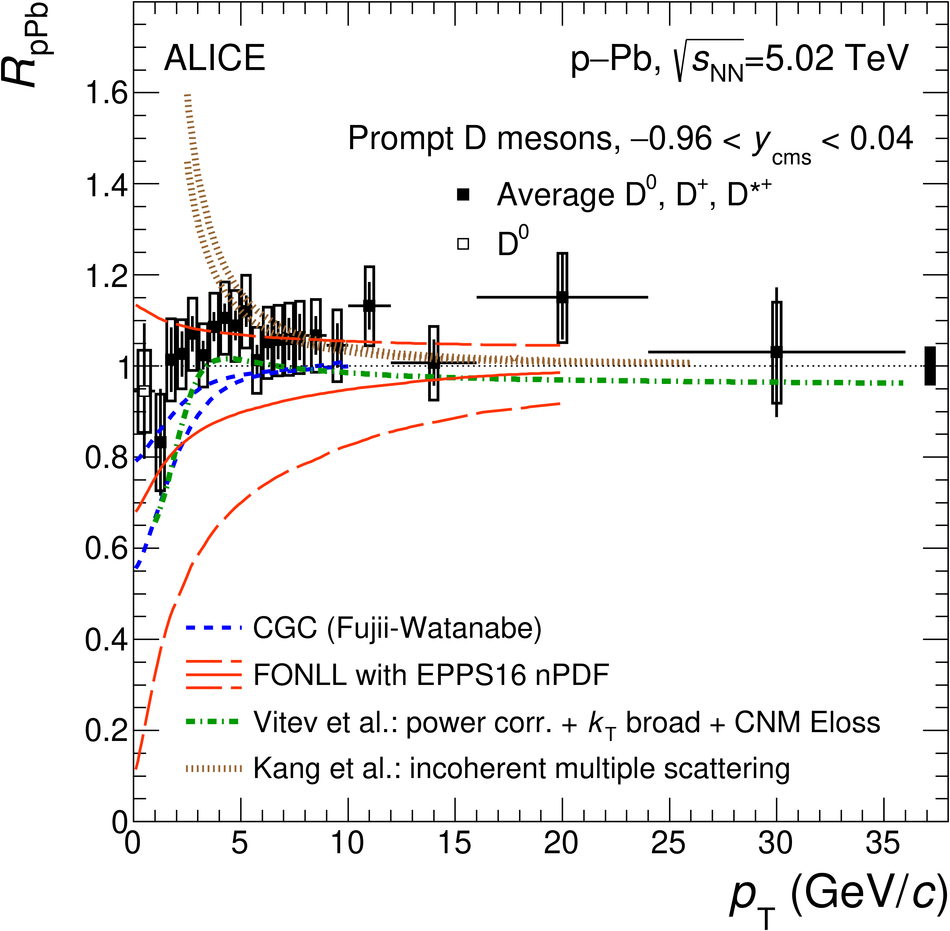 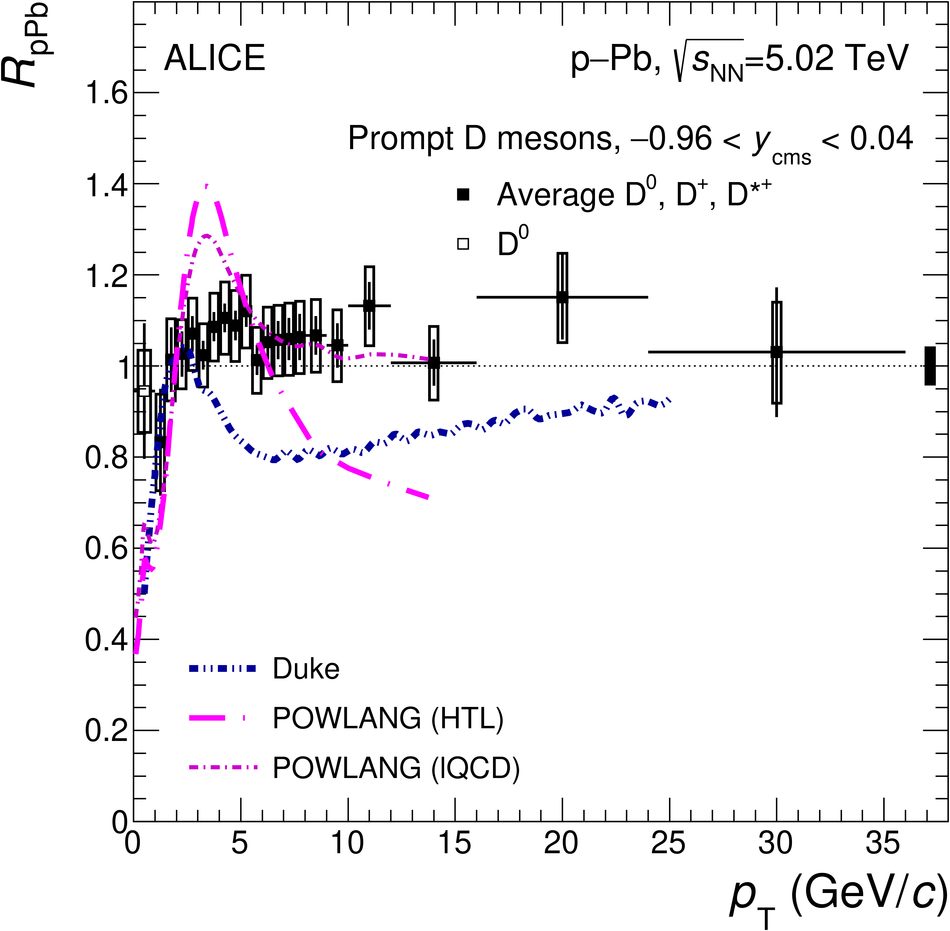 |
Figure 10
Nuclear modification factors of prompt D mesons as a function of $\pt$ in 0--10\%, 10--20\%, 20--40\%, 40--60\%, and 60--100\% centrality classes compared with those of charged particles The vertical bars represent the statistical uncertainties while the empty boxes and the shaded boxes represent the systematic uncertainties for the prompt D mesons and for the charged particles. The colour-filled boxes at $\QpPb$ $=1$ represent the normalisation uncertainties on the $\langle \TpPb \rangle$ . | 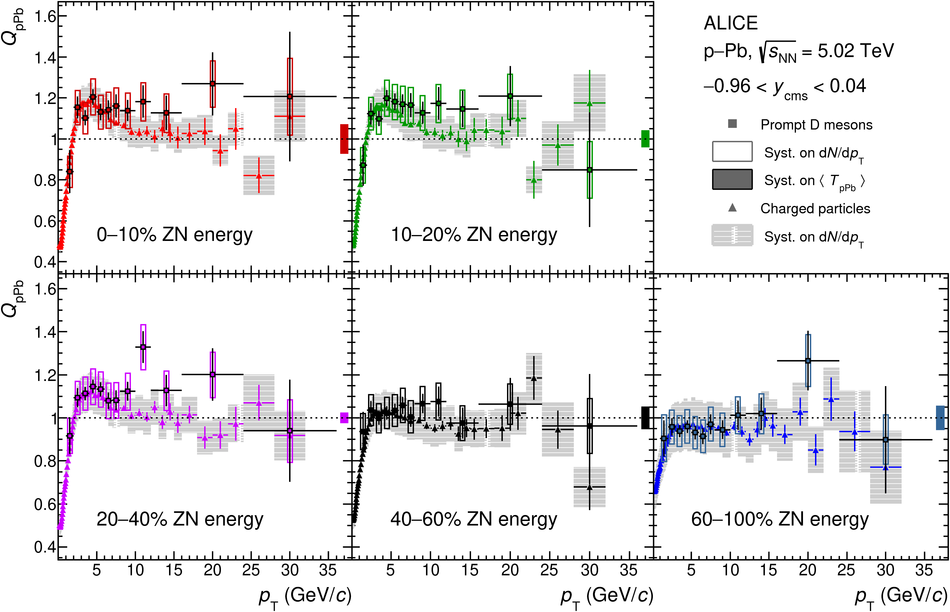 |
Figure 11
D-meson $\QpPb$ measured in the 0--10\% centrality class compared with the predictions of the Duke and POWLANG transport models. The vertical bars and the empty boxes represent the statistical and systematic uncertainties. The colour-filled boxes at $\QpPb$ $=1$ represent the normalisation uncertainties. |  |
Figure 12
Average D-meson and charged-particles $\Qcp$ using the yields measured in 0--10\%, 10--20\%, 20--40\%, and 40--60\% as numerators and the yield in 60--100\% as the denominator. The vertical bars and the empty boxes represent the statistical and systematic uncertainties. The colour-filled boxes at $\Qcp$ $=1$ represent the normalisation uncertainties on the $ \langle \TpPb \rangle$ | 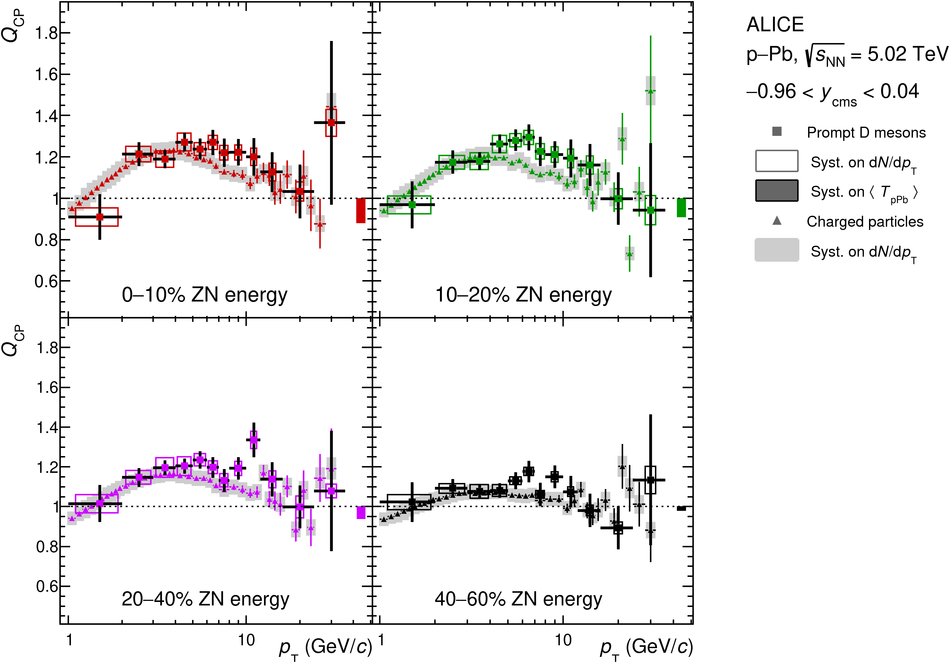 |
Figure 13
Ratios of prompt D-meson production cross sections as a function of $\pt$ in p--Pb collisions at \mbox{$\sqrtsNN=5.02 \tev$} The results are compared with those of pp collisions at the same centre-of-mass energy . The vertical bars and the empty boxes represent the statistical and systematic uncertainties. | 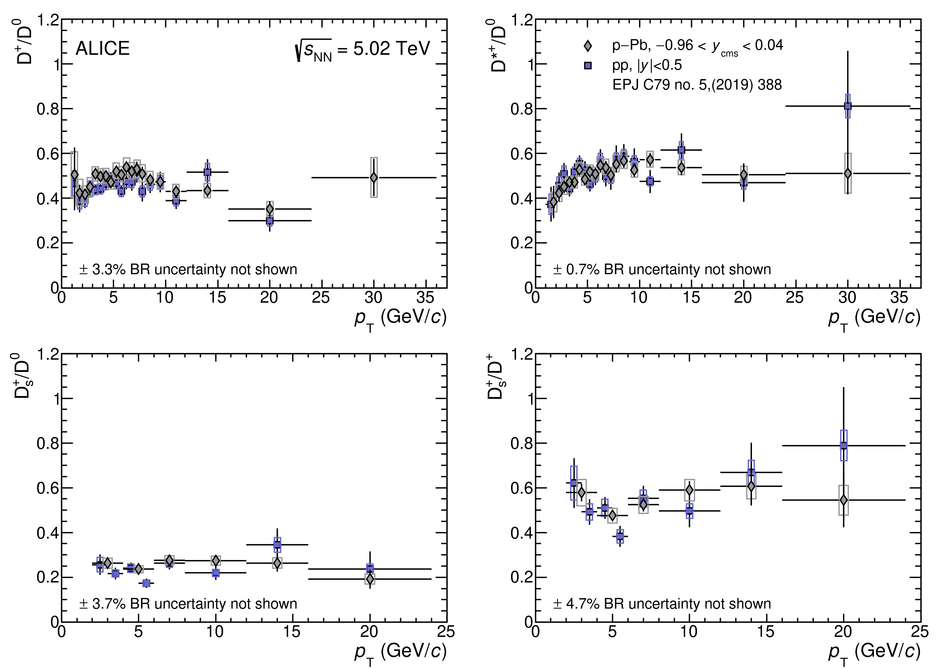 |
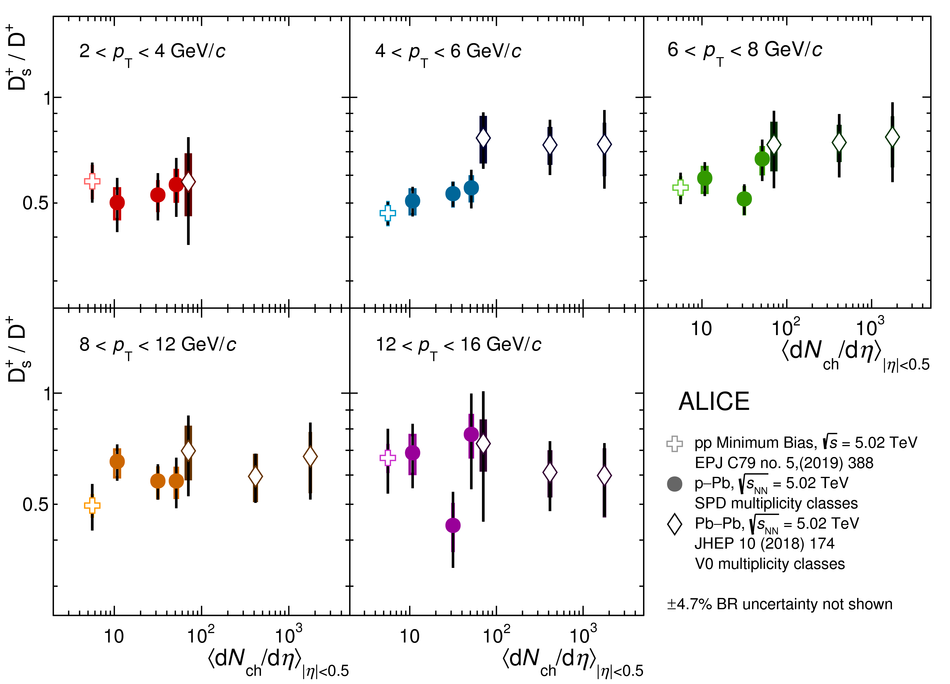
Figure 15
$\Dzero$, $\Dplus$, and $\Dstar$ meson nuclear modification factors as a function of $\pt$ in the 0--10\% (left) and 60--100\% (right) centrality classes The vertical bars and the empty boxes represent the statistical and systematic uncertainties. The colour-filled boxes at $\QpPb$ $=1$ represent the normalisation uncertainties | 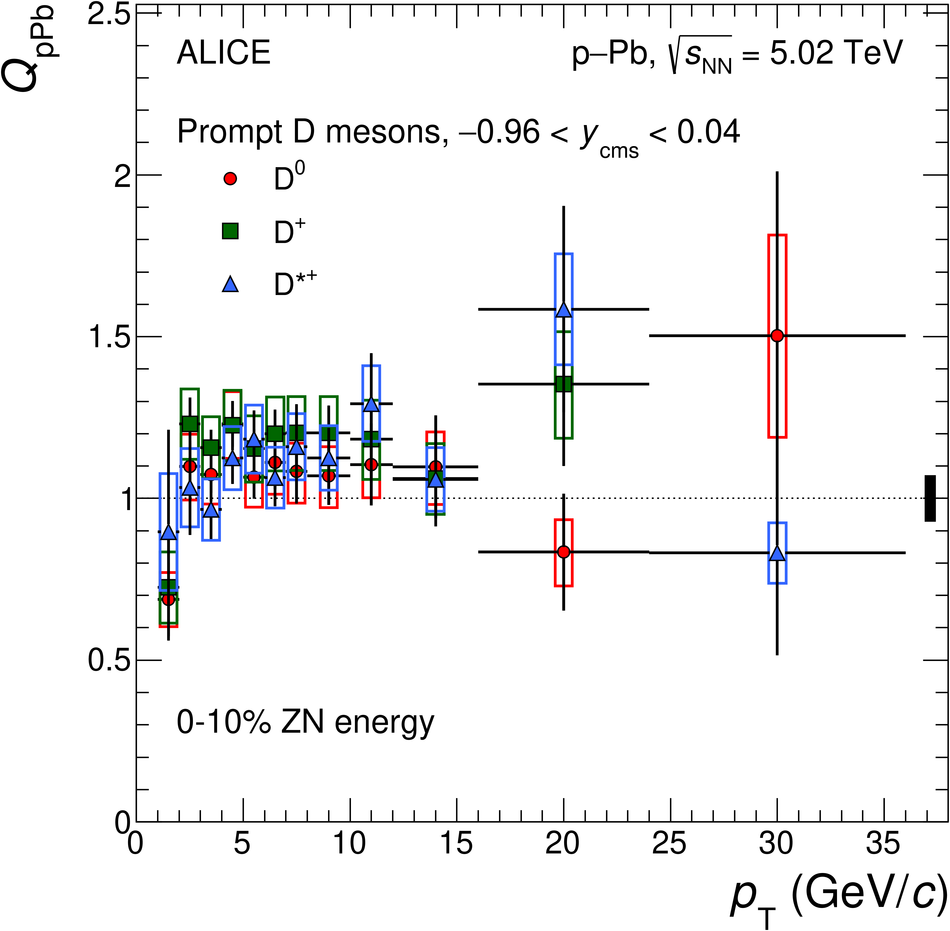 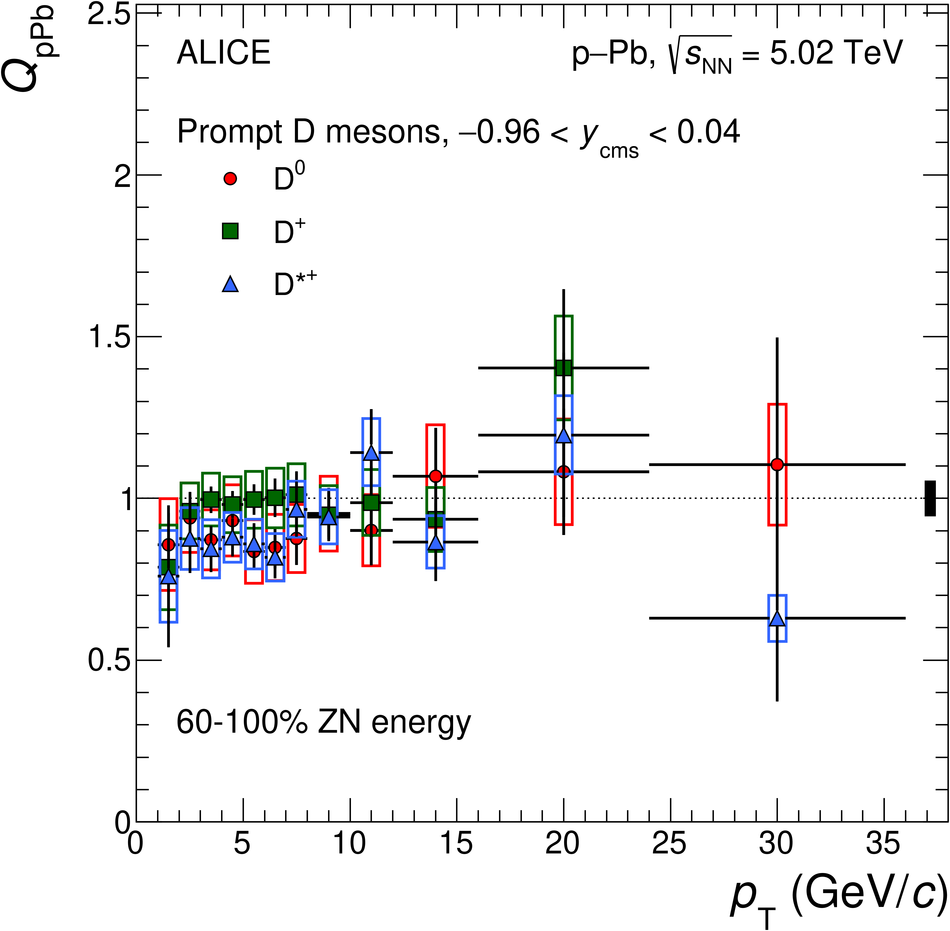 |
Figure 16
$\Dzero$, $\Dplus$, and $\Dstar$ meson $\Qcp$, obtained using 0--10\% as the central class and 60--100\% as the peripheral class The vertical bars and the empty boxes represent the statistical and systematic uncertainties, respectively. The colour-filled boxes at $\Qcp$$=1$ represent the normalisation uncertainties |  |