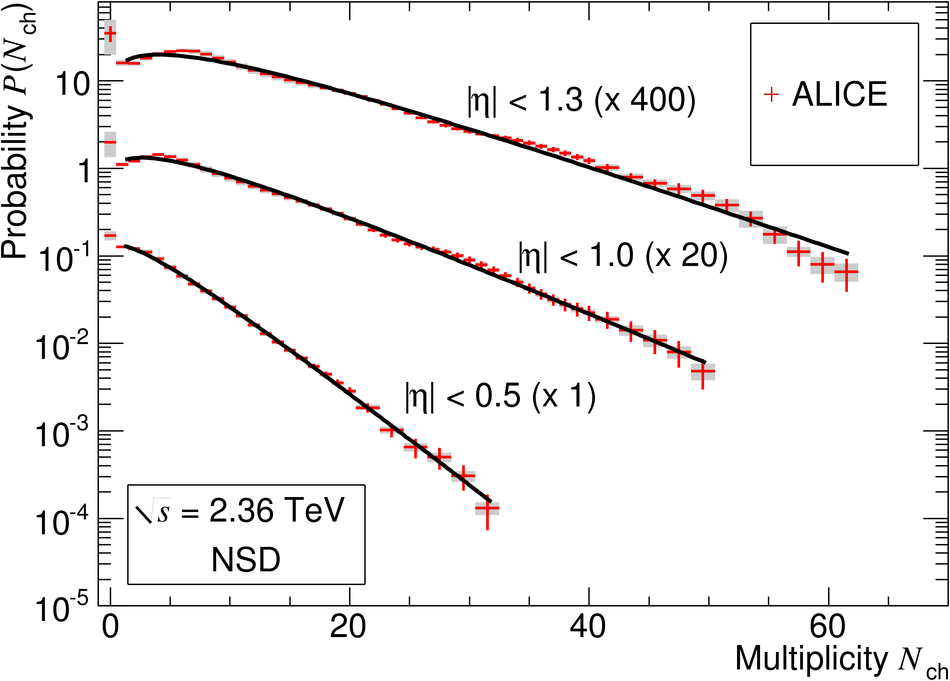
Corrected multiplicity distributions in three pseudorapidity ranges for NSD events. The solid lines show NBD fits. Error bars represent statistical uncertainties and shaded area systematic ones. Top: Data at $\sqrt{s} = 0.9 $TeV. The ALICE measurement for |$\eta$| < 0.5 is compared to the UA5 data at the same energy \cite{ua5_mult3}. In the inset the ratio of these two measurements is shown, the shaded area represents our combined statistical and systematic uncertainty, and the error bars those of UA5. Bottom: Data at $\sqrt{s} = 2.36 $TeV. Note that for |$\eta$| < 01.0 and |$\eta$| < 01.3 the distributions have been scaled for clarity by the factor indicated. | 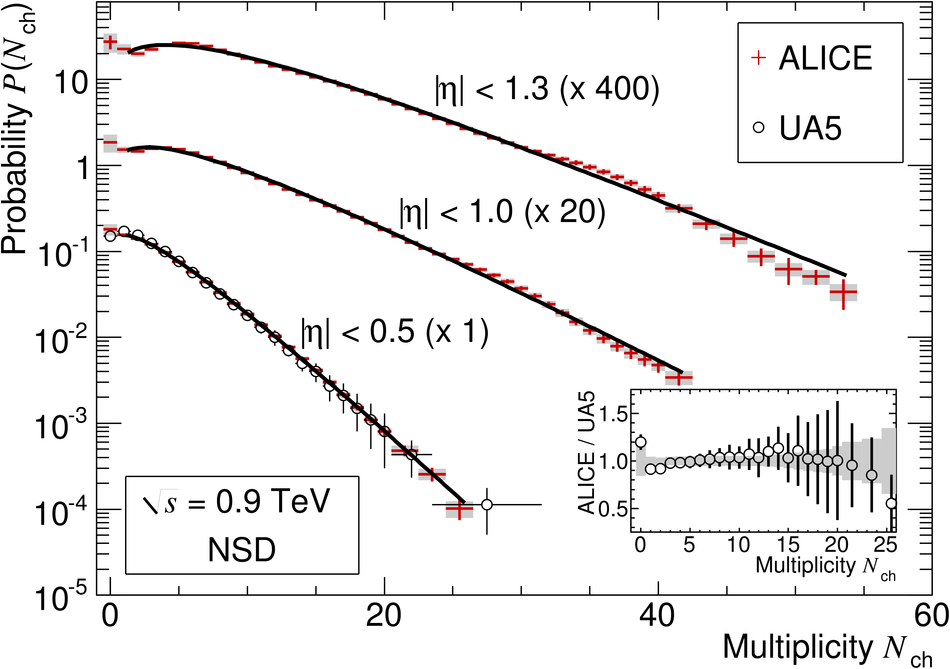 |