Distribution of ln[d$E$/d$x$]$_{\rm meas}-$ln[d$E$/d$x$(K)]$_{\rm calc}$ measured with the ITS in the two $\pt$-ranges, 300-350 MeV/$c$ (upper panels) and 400-450 MeV/$c$ (lower panels), using the kaon mass hypothesis. The left panels show the result for ITS-TPC combined tracks, while the right panels show the ITS stand-alone result. The lines indicate fits as described in the text. | 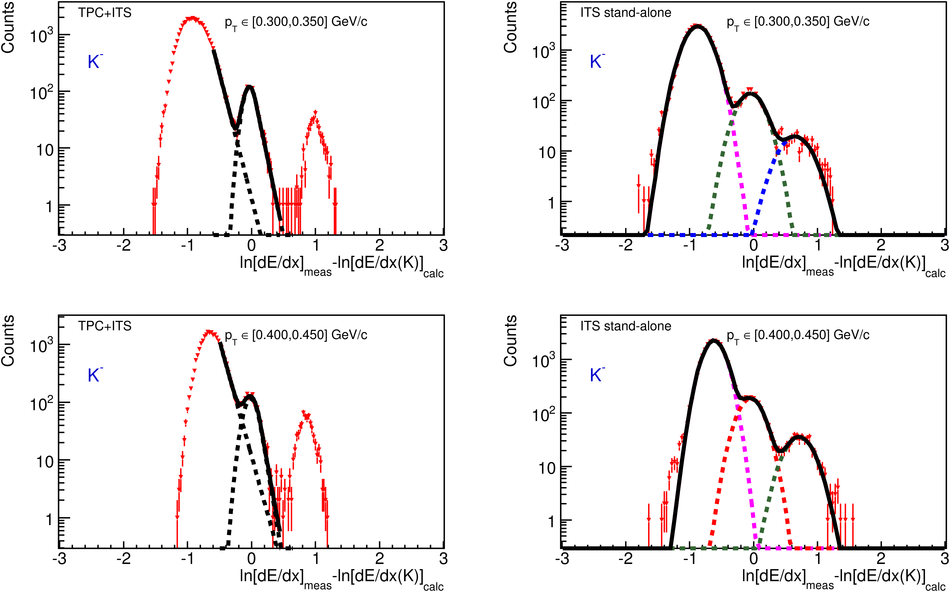 |