Charged-particle multiplicity measurement in proton-proton collisions at $\sqrt{s} = 7~$TeV with ALICE at LHC

The pseudorapidity density and multiplicity distribution of charged particles produced in proton-proton collisions at the LHC, at a centre-of-mass energy $\sqrt{s} = 7~$TeV
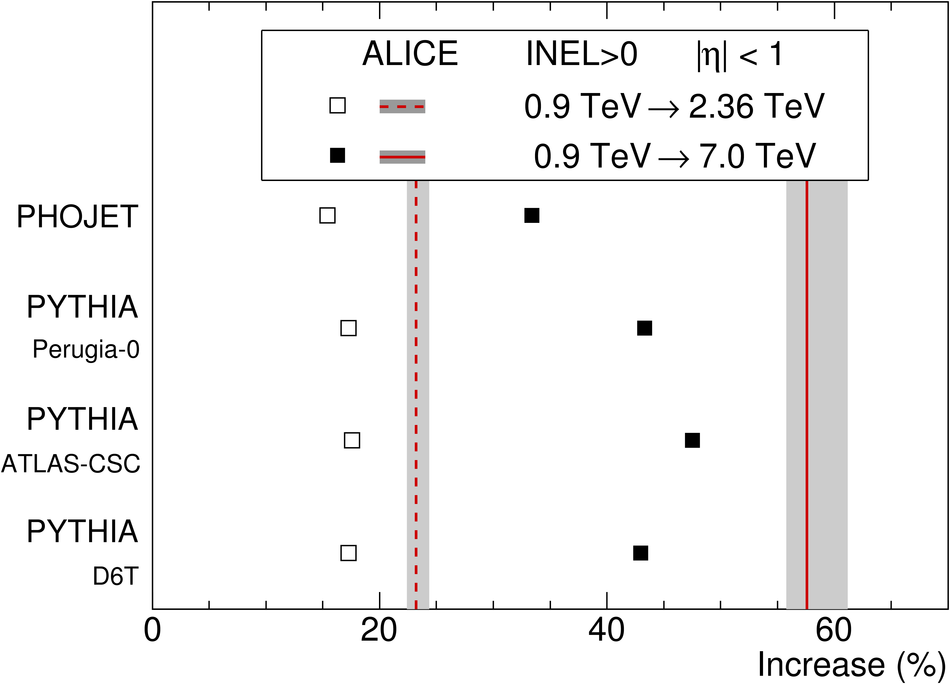
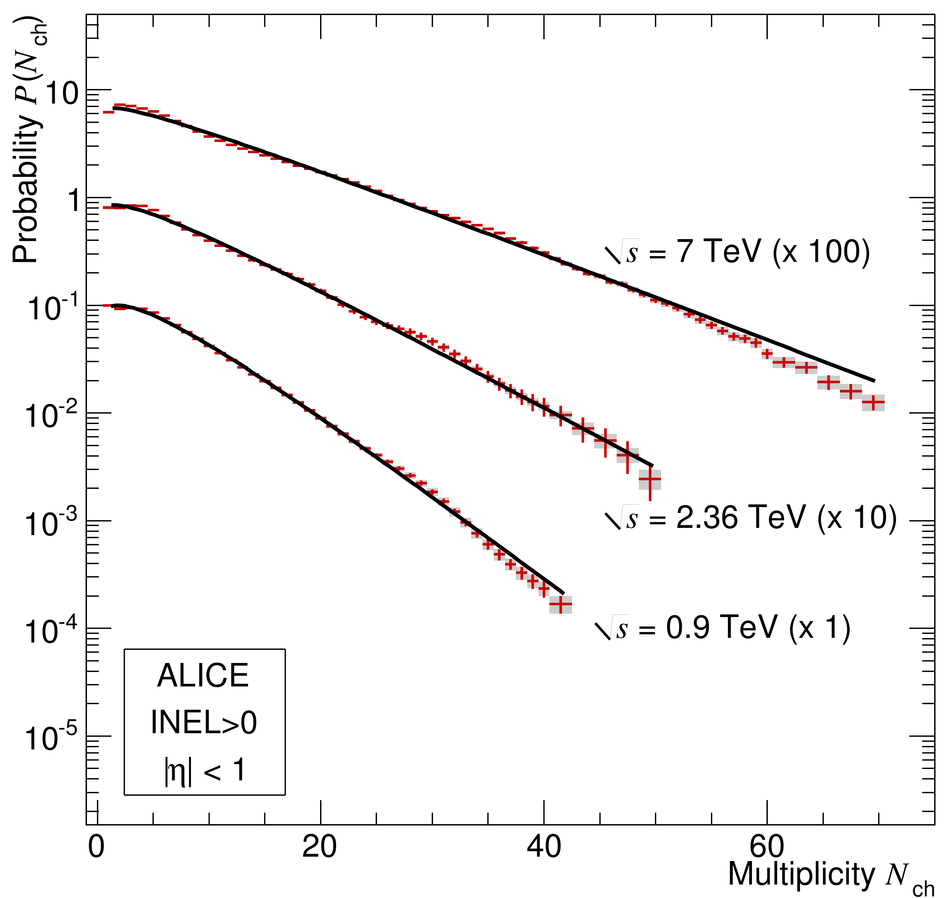
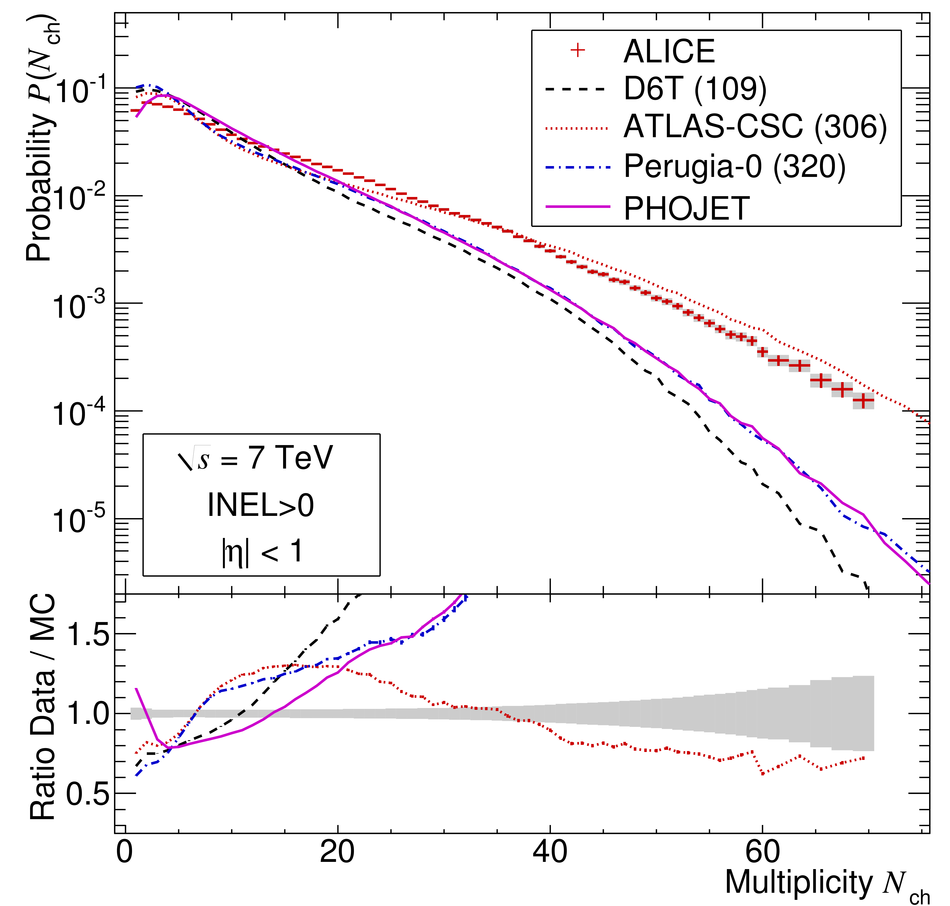
were measured in the central pseudorapidity region |$\eta$| < 1. Comparisons are made with previous measurements at sqrt(s) = 0.9 TeV and 2.36 TeV. At sqrt(s) = 7 TeV, for events with at least one charged particle in |$\eta$| < 1, we obtain d$N_{\rm ch}$/d$\eta$ = 6.01 +- 0.01 (stat.) +0.20 -0.12 (syst.). This corresponds to an increase of 57.6% +- 0.4% (stat.) +3.6 -1.8% (syst.) relative to collisions at 0.9 TeV, significantly higher than calculations from commonly used models. The multiplicity distribution at 7 TeV is described fairly well by the negative binomial distribution.


Eur. Phys. J. C 68 (2010) 345-354
HEP Data
e-Print: arXiv:1004.3514 | PDF | inSPIRE
CERN Record

Figure 1

Relative increase of the charged-particle pseudorapidity density, for inelastic collisions having at least one charged particle in |$\eta$| < 1, between $\sqrt{s} = 0.9 $TeV and 2.36 TeV (open squares) and between $\sqrt{s} = 0.9 $TeV and 7 TeV (full squares), for various models. Corresponding ALICE measurements are shown with vertical dashed and solid lines; the width of shaded bands correspond to the statistical and systematic uncertainties added in quadrature.

Figure 2

Charged-particle pseudorapidity density in the central pseudorapidity region |$\eta$| < 0.5 for inelastic and non-single-diffractive collisions [4,16-25], and in |$\eta$| < 1 for inelastic collisions with at least one charged particle in that region (INEL$>$0$_{|\eta|< 1}$), as a function of the centre-of-mass energy. The lines indicate thefit using a power-law dependence on energy. Note that data points at the same energy have been slightly shifted horizontally for visibility.

Figure 3

Measured multiplicity distributions in |$\eta$| < 1 for the INEL$>$0$_{|\eta|< 1}$ event class. The error bars for data points represent statistical uncertainties, the shaded areas represent systematic uncertainties. Top: The data at the three energies are shown with the NBD fits (lines). Note that for the 2.36 TeV and 7 TeV data the distributions have been scaled for clarity by the factors indicated. Bottom: The data at 7 TeV are compared to models: PHOJET (solid line), PYTHIA tunes D6T (dashed line), ATLAS-CSC (dotted line) and Perugia-0 (dash-dotted line). In the lower part, the ratios between the measured values and model calculations are shown with the same convention. The shaded area represents the combined statistical and systematic uncertainties.