The $M_{\mu\mu}$ distribution in 3 $< $ $p_{\rm T}^{\mu\mu}$ $< $ 6 GeV/$c$ interval fitted with a combination of an CB2 function for the signal and a VWG function for the background, for high-multiplicity (left panel) and low-multiplicity (middle panel) p--Pb collisions at $\sqrt{s_{\rm NN}}$ = 8.16 TeV. Right panel illustrates the fit from Eq. (\ref{eq:ext_meth_2}) in the same $p_{\rm T}^{\mu\mu}$ interval. The shaded area corresponds to the signal term in Eq. (\ref{eq:ext_meth_2}). | 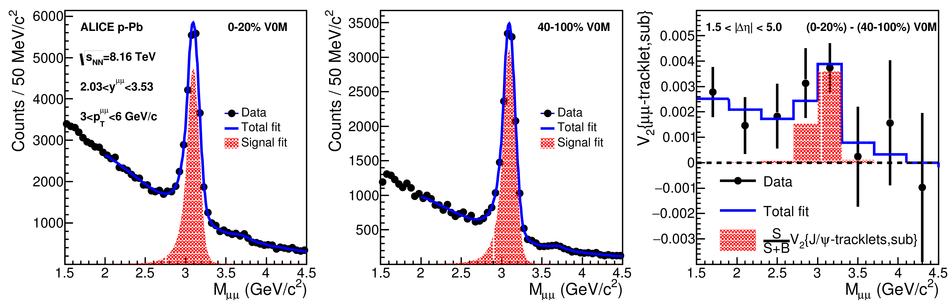 |