Trigger turn-on curves: the ratio of inclusive electrons in EMCal triggered events to minimum-bias events as a function of associated track $\pt$ in centrality bins between 0% and 50%. The lower right panel shows a similar ratio obtained with EMCal clusters for centrality 50-80%. The $\pt$ from which the spectra from the minimum-bias trigger to the EMCal trigger are used are indicated with black dashed lines. The scaling factors which were obtained by fits (red lines) are summarized in Table 1. | 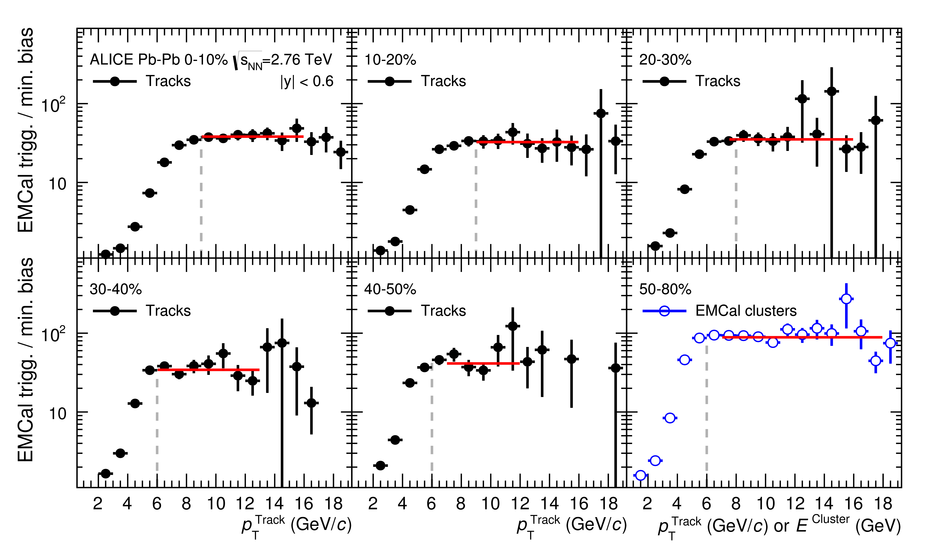 |