Measured $\eta/\pi^0$ ratio in pp collisions at $\sqrt{s} = 2.76$ TeV compared to NLO pQCD calculations [6,33] and PYTHIA 8.2 [14] generator-level simulations using the Monash 2013 tune. The horizontal error bars denote statistical, the boxes systematic uncertainties. The data at $\sqrt{s}=0.2$ TeV [34] and $\sqrt{s}=7$ TeV [4] are shown with statistical and systematic uncertainties added in quadrature. | 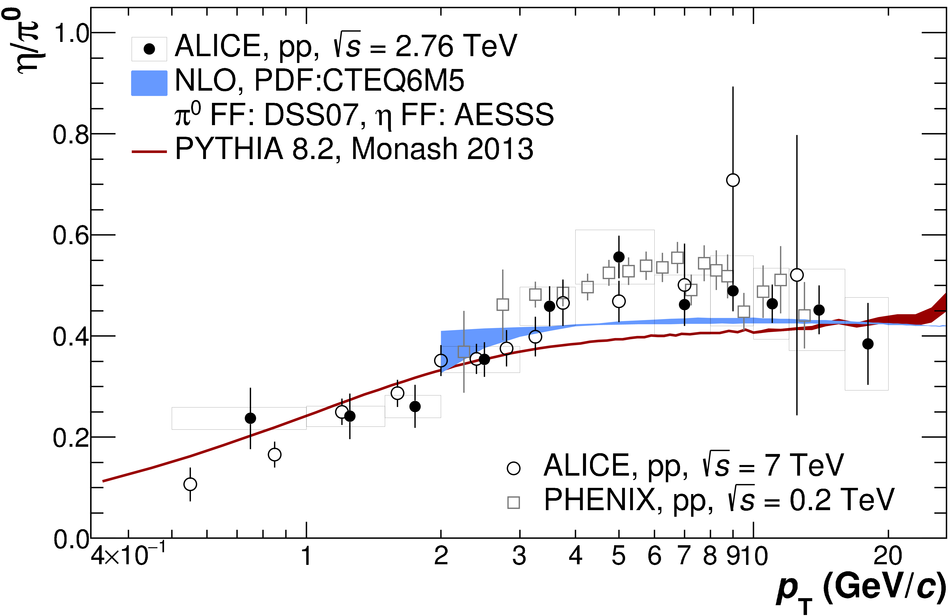 |