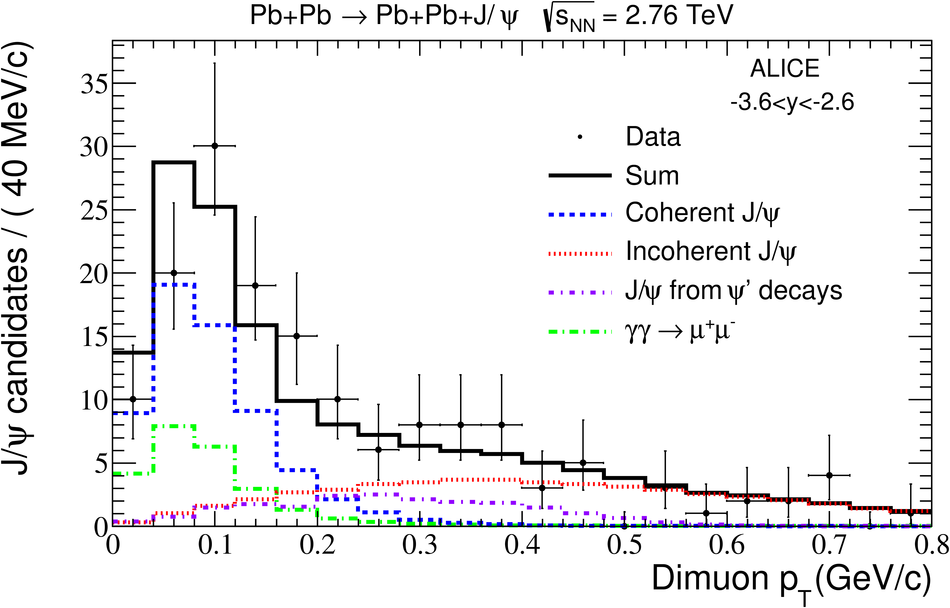
Dimuon $\pt$ distribution for events satisfying the event selection described inthe text. The data points are fitted summing four different Monte Carlo templates: coherent \jpsi production(dashed - blue), incoherent J/$\psi$ production (dotted - red), J/$\psi$s from $\psi^{'}$ decay(dash-dotted - violet), and $\gamma \gamma \rightarrow \mu^+ \mu^-$ (dash-dotted - green). The solid histogram (black) is the sum. |  |