Distributions of the invariant mass for $\Dzero$ (top left), $\Dplus$ (top right), $\Ds$ (bottom left) candidates and their charge conjugates and of the mass difference for $\Dstar$ (bottom right) candidates (and charge conjugates) in the rapidity interval $|y_{\rm lab}|< y_{\mathrm{fid}}(\pt)$ in p--Pb collisions. The dashed lines represent the fit to the background while the solid lines represent the total fit function. One $\pt$ interval is shown for each species: $1< \pt< 2 \gevc$ for $\Dzero$, $5< \pt< 6 \gevc$ for $\Dplus$, $8< \pt< 12 \gevc$ for $\Ds$ and $16< \pt< 24 \gevc$ for $\Dstar$. | 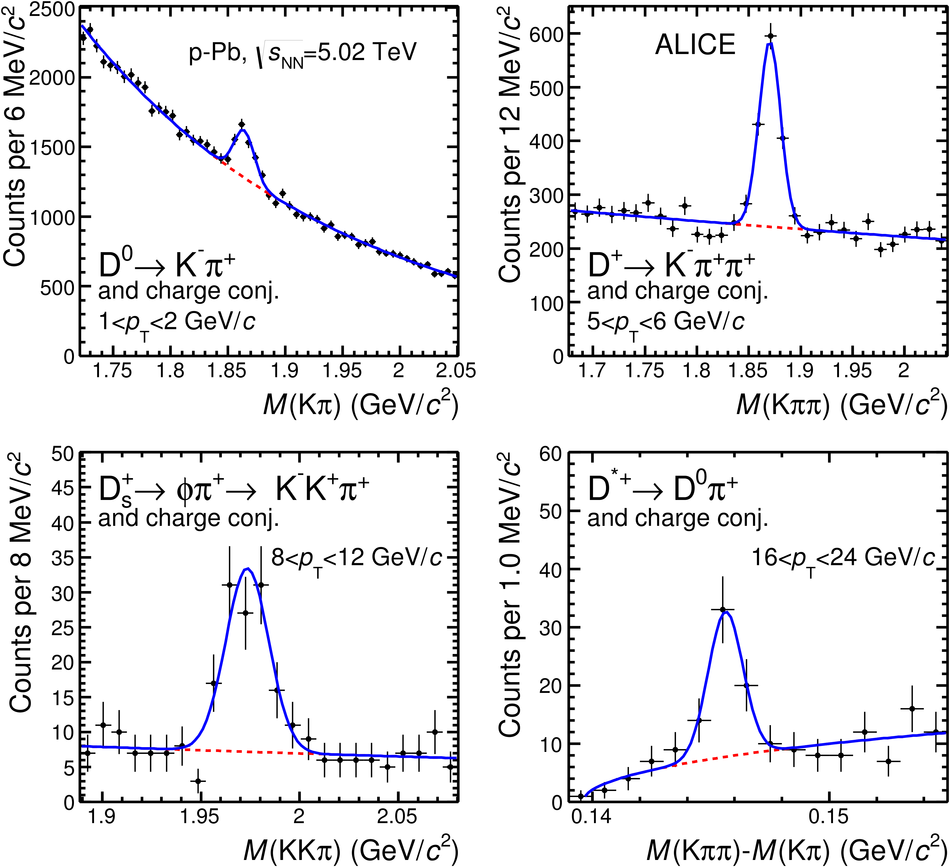 |