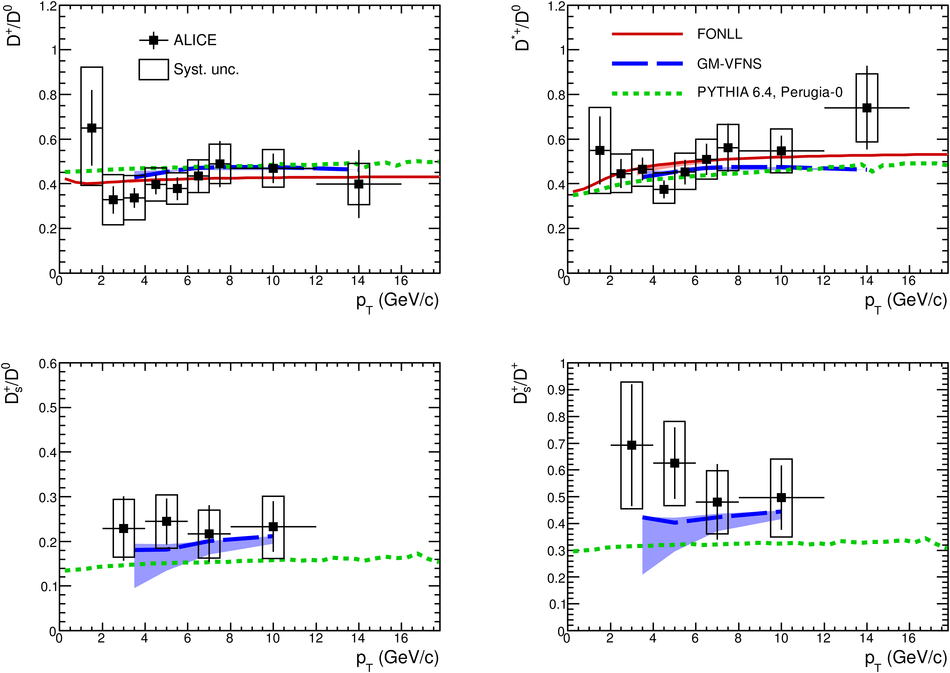
Ratios of D meson production cross sections as a function of $\pt$ Predictions from FONLL, GM-VFNS and PYTHIA 6.4.21 with the Perugia-0 tuneare also shown. For FONLL and GM-VFNS the line shows the ratio of the central values of the theoretical cross section, while the shaded area is defined by the ratios computed from the upper and lower limits of thetheoretical uncertainty band.
|  |