Projections of Fig. \ref{fig:fitexample} \subref{subfig:fit1} to the $\Dphi$ \protect\subref{subfig:results2c_projPhi} and $\Deta$ \protect\subref{subfig:results2c_projEta} directions. The projections integrated over $|\Deta| < 1.6$ and $|\Dphi| < \pi/2$, respectively, present per-trigger yields (and not densities) and therefore the level of the background is different than in Fig. \ref{fig:fitexample}. The fit and the background component of the fit are overlaid with the data. | 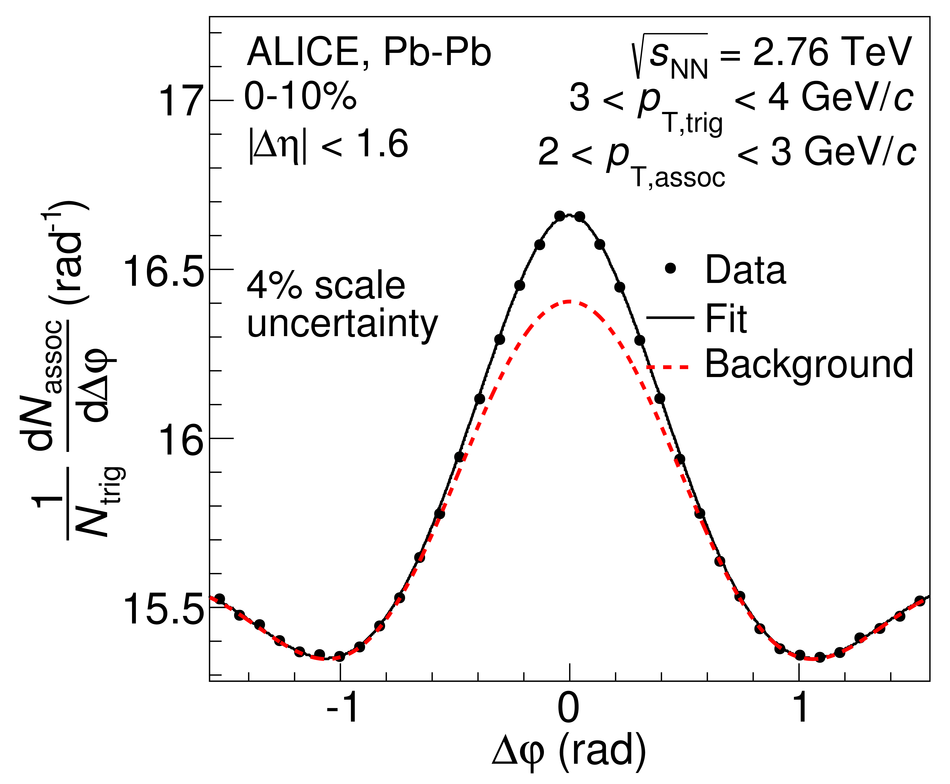 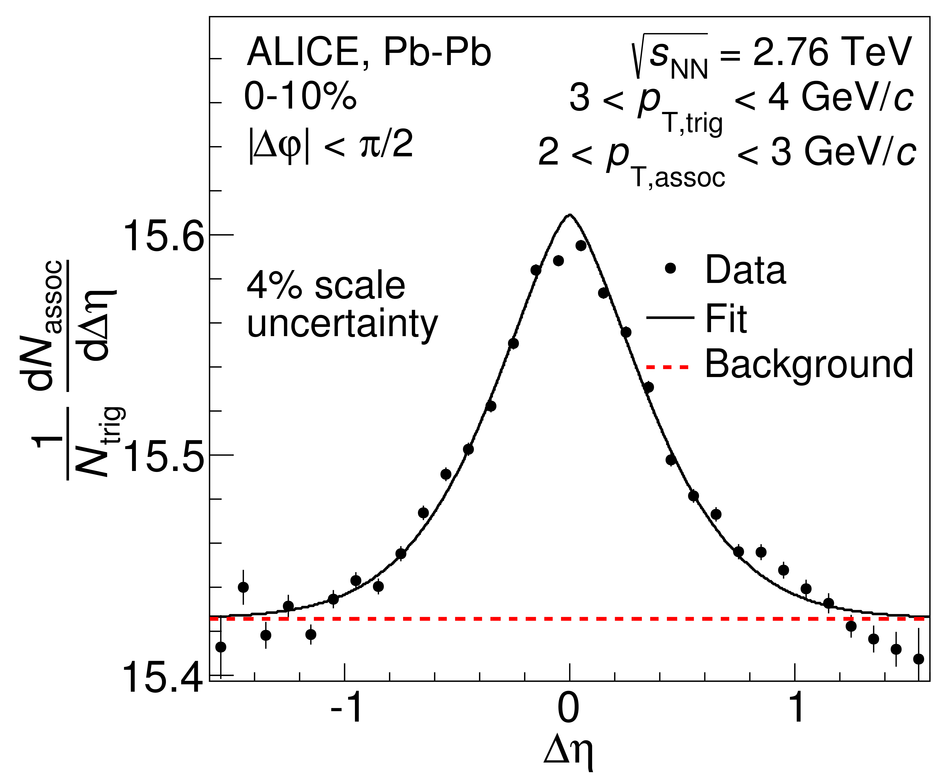 |