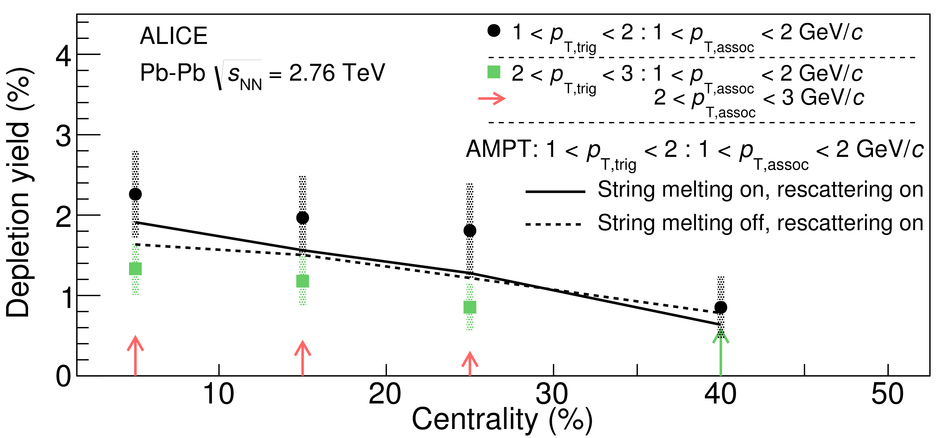
The measurement of two-particle angular correlations is a powerful tool to study jet quenching in a $p_{\mathrm{T}}$ region inaccessible by direct jet identification. In these measurements pseudorapidity ($\Delta\eta$) and azimuthal ($\Delta\varphi$) differences are used to extract the shape of the near-side peak formed by particles associated to a higher $p_{\mathrm{T}}$ trigger particle ($1 <~ p_{\mathrm{T, trig}} <~$ 8 GeV/c). A combined fit of the near-side peak and long-range correlations is applied to the data allowing the extraction of the centrality evolution of the peak shape in Pb-Pb collisions at $\sqrt{s_{\mathrm{NN}}}$ = 2.76 TeV. A significant broadening of the peak in the $\Delta\eta$ direction at low $p_{\mathrm{T}}$ is found from peripheral to central collisions, which vanishes above 4 GeV/c, while in the $\Delta\varphi$ direction the peak is almost independent of centrality. For the 10% most central collisions and $1 <~ p_{\mathrm{T, assoc}} <~$ 2 GeV/c, $1 <~ p_{\mathrm{T, trig}} <~$ 3 GeV/c a novel feature is observed: a depletion develops around the centre of the peak. The results are compared to pp collisions at the same centre of mass energy and to AMPT model simulations. The comparison to the investigated models suggests that the broadening and the development of the depletion is connected to the strength of radial and longitudinal flow.
Phys.Rev.Lett. 119 (2017) 102301
HEP Data
e-Print: arXiv:1609.06643 | PDF | inSPIRE
CERN-EP-2016-229
Figure 1
Left panel: associated yield per trigger particle as a function of $\Dphi$ and $\Deta$. The background obtained from the fit function has been subtracted in order to emphasize the near-side peak. Right panel projections to the $\Dphi$ and $\Deta$ axes overlaid with the peak part of the fit function. | 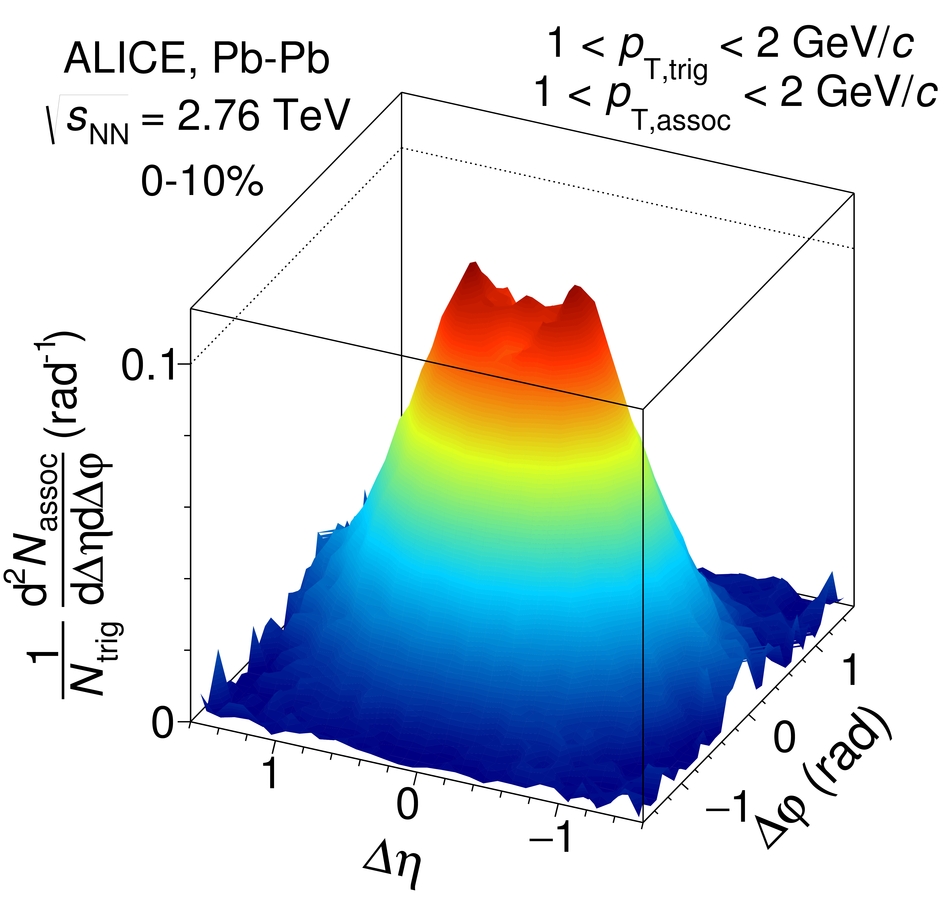 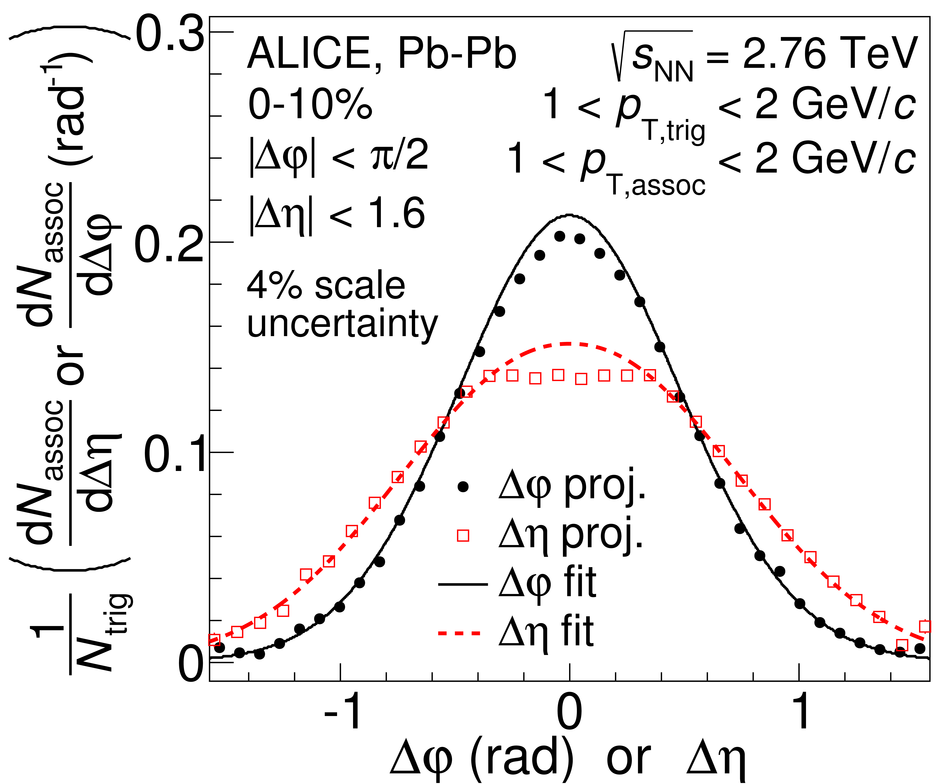 |
Figure 2
Shape parameters $\sigma_{\Dphi}$ (left panel) and $\sigma_{\Deta}$ (right panel) as a function of centrality in different $\pt$ ranges. Lines indicate statistical uncertainties (mostly smaller than the marker size), while boxes denote systematic uncertainties. The markers are placed at the centre of the centrality bins | 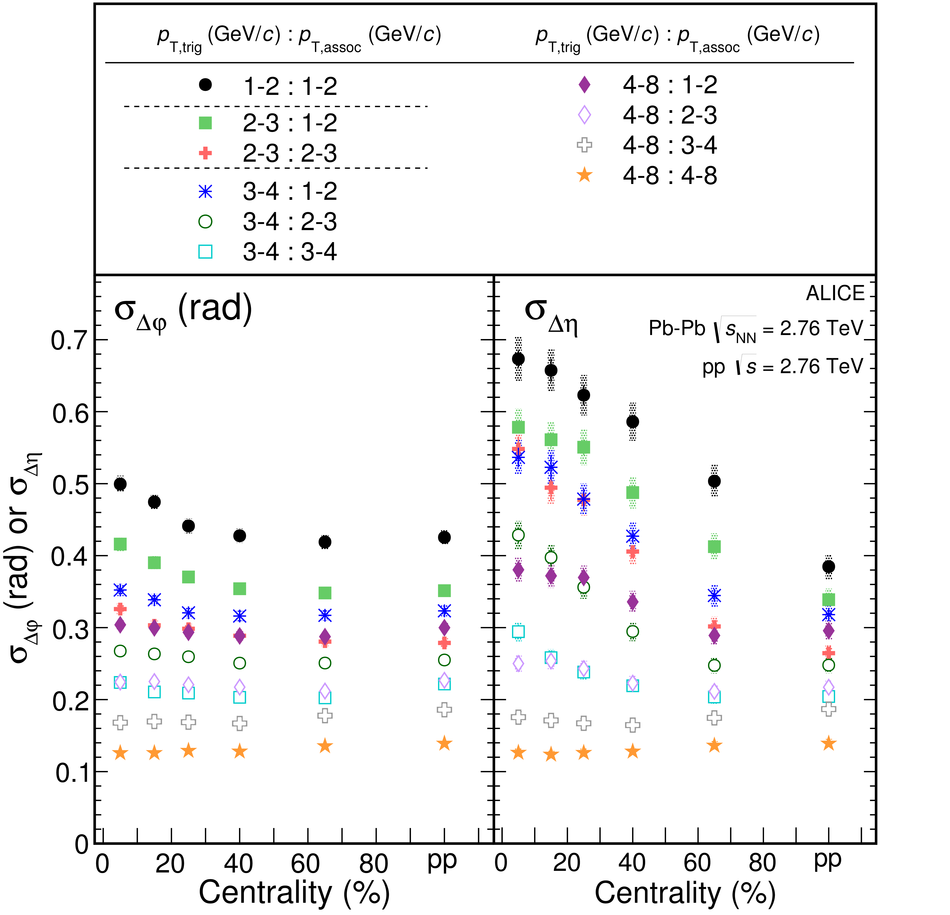 |
Figure 3
Ratio of the peak widths in $\Dphi$ (top) and $\Deta$ (bottom) observed in central (0-10\%) and peripheral (50-80\%) collisions as a function of $\pt _{\rm ,trig}$ and $\pt _{\rm ,assoc}$ ranges. The data is compared to different AMPT settings. Note that the $x$-axis combines the $\pta$ and $\ptt$ axis, and therefore, a uniform trend of the values is not expected | 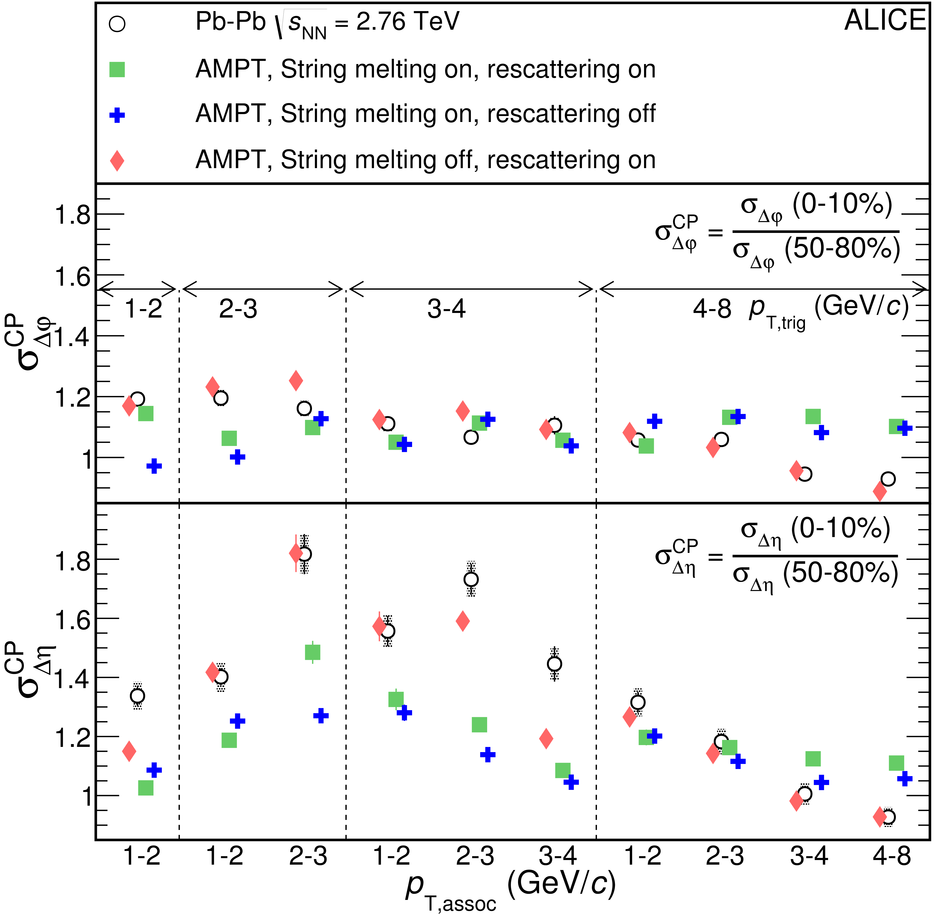 |