Invariant mass distribution for opposite-sign muon pairs ($2.5< y< 4$, all $p_{\rm T}$),in the mass region $1.5< m_{\mu\mu}< 5$ GeV/$c^2$ with the result of the fit. The plot refers to the sub-period with the largest statistics($N_{\rm J/\psi}=957\pm56$, corresponding to $L_{\rm int}$ = 7.9 nb$^{-1}$) The fitted J/$\psi$ and $\psi(2S)$ contributions, as well as the background, are also shown. | 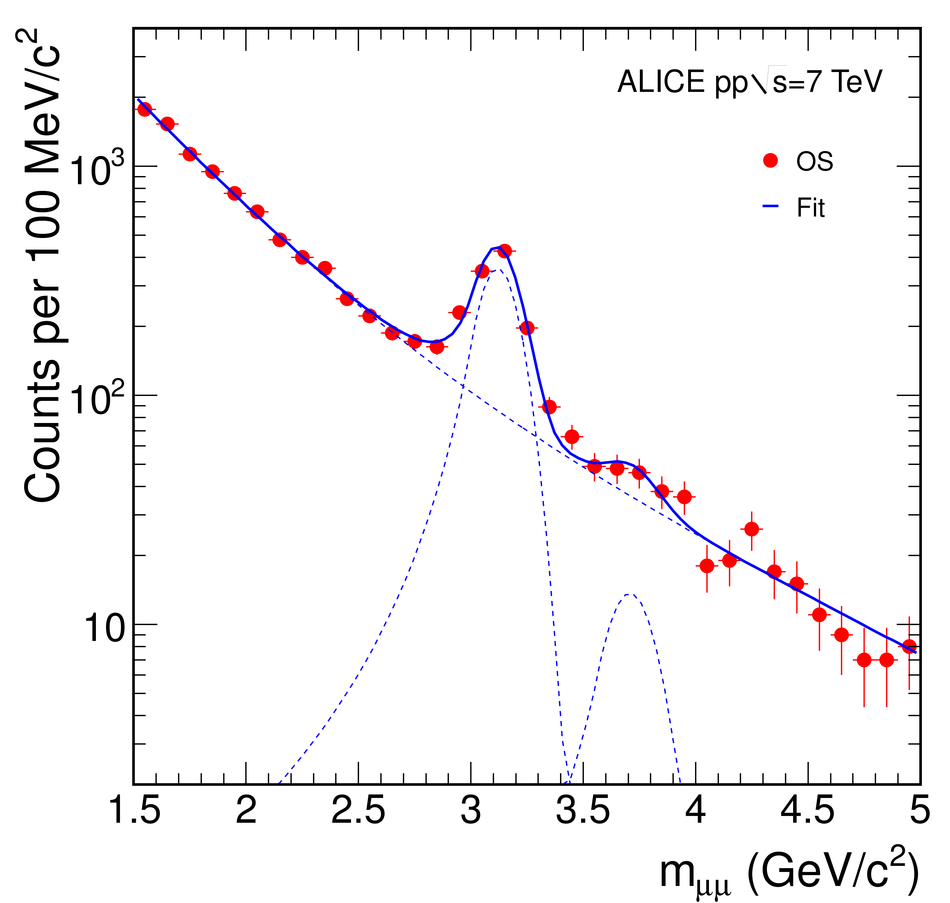 |