Average $\Dzero$, $\Dplus$ and $\Dstar$ meson $\QpPb$ as a function of centrality with the CL1, the V0A and the ZNA estimators for (a) $2< \pt< 4 \gevc$ and (b) $8< \pt< 12 \gevc$. The average D-meson $\QpPb$ in $8< \pt< 12 \gevc$ is compared with the charged-particle $\QpPb$ calculated for $\pt>10 \gevc$ The vertical error bars and the empty boxes represent, respectively, the statistical and systematic uncertainties on the D-meson results The filled boxes at $\QpPb=1$ indicate the correlated systematic uncertainties: the grey-filled box represents the uncertainty on the pp reference and the p-Pb analysis PID and track selection uncertainties, common to all estimators for a given $\pt$ interval; the red-filled box represents the correlated systematic uncertainty on $\Ncoll$ determination for the ZNA energy estimator | 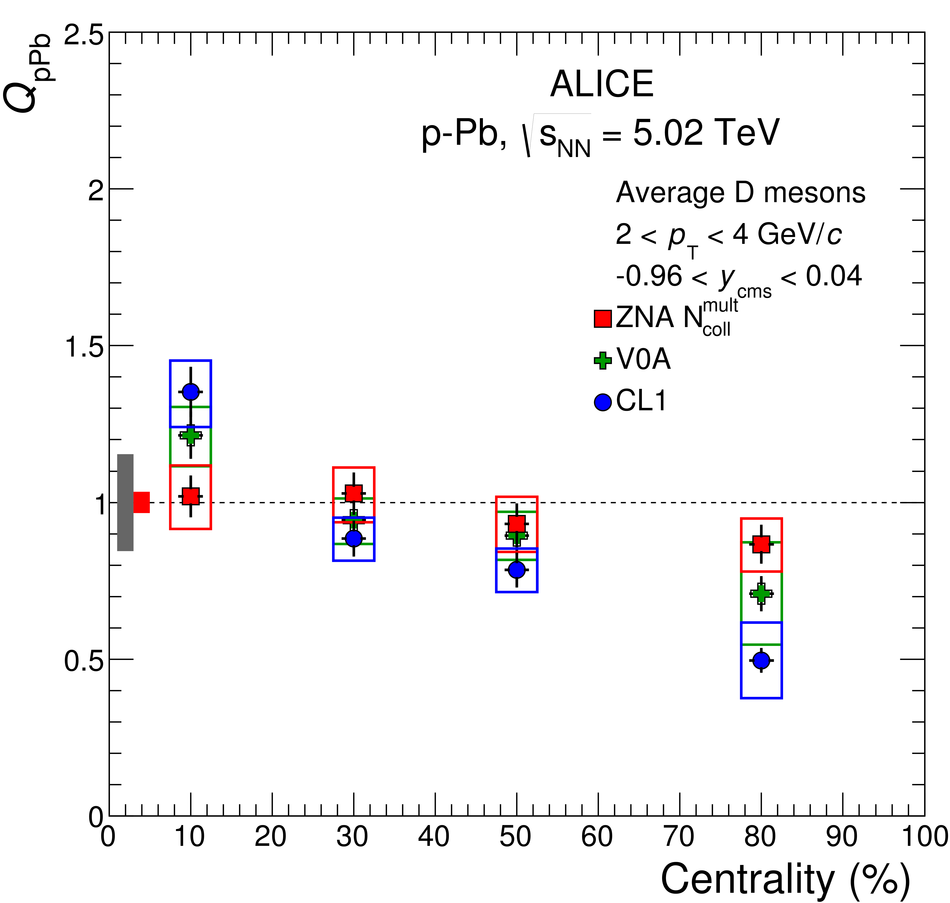 |
