The signal (black solid circle) and the background yields after the application of the track selection criteria including the one on $d_{\mathrm 0}$. The background electrons (red solid line), i.e. the sum of the electrons from charm hadron decays, from Dalitz and dilepton decays of light mesons, and from photon conversions, were subtracted from the inclusive electron spectrum (black open circle). The error bars represent the statistical uncertainties. The symbols are plotted at the center of each bin. | 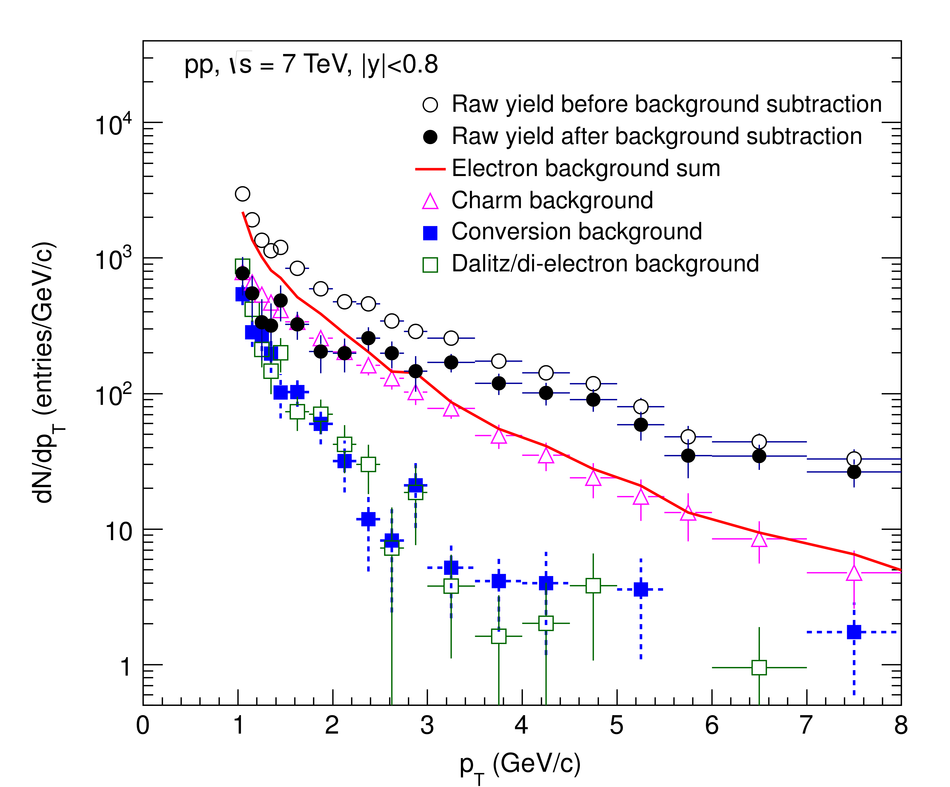 |