Projections of the Cartesian representation of the three-dimensional two-pion correlation functions along the $out$ (a), $side$ (b) and $long$ (c) axes. The centrality and pair momentum ranges for the three functions are given on the plot. In each case the other components are projected over $\pm$ 20 MeV/$c$ around 0 in the other $q$ directions for central collisions at low \kt and $\pm$ 33 MeV/$c$ in the other two cases. Lines represent the corresponding projections of the fit to the experimental correlation functions with formula from Eq. \eqref{eq:cfitfun}. | 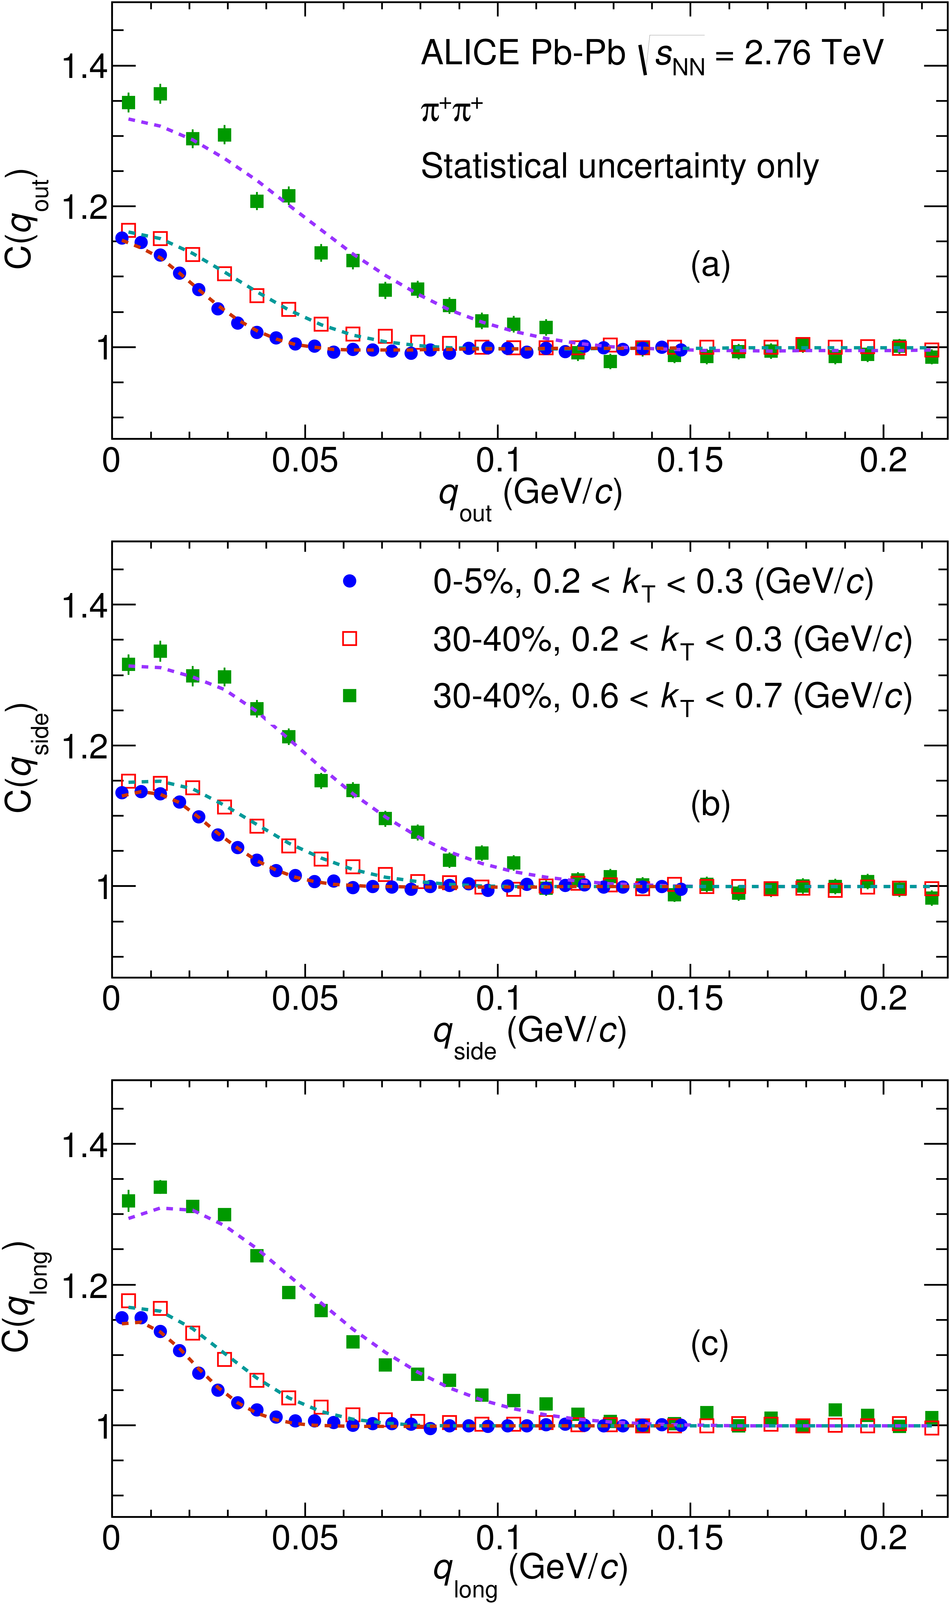 |