Measurement of d$N_{ch}/$d$\eta$ per centrality from SPD (squares) and FMD (circles) separately. Error bars reflect
the total uncorrelated systematic uncertainty and statistical error on each point. Error bars on the left and right reflect the
correlated systematic uncertainties on the SPD and FMD points, respectively. Previously published results for 0-30%
over the full pseudorapidity range (diamonds) and for 0-80% at mid-rapidity (stars) [7] are also shown. | 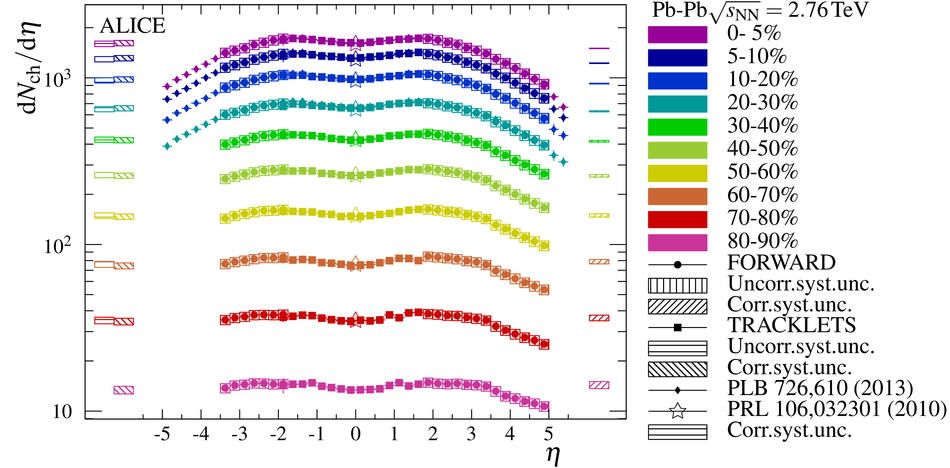 |