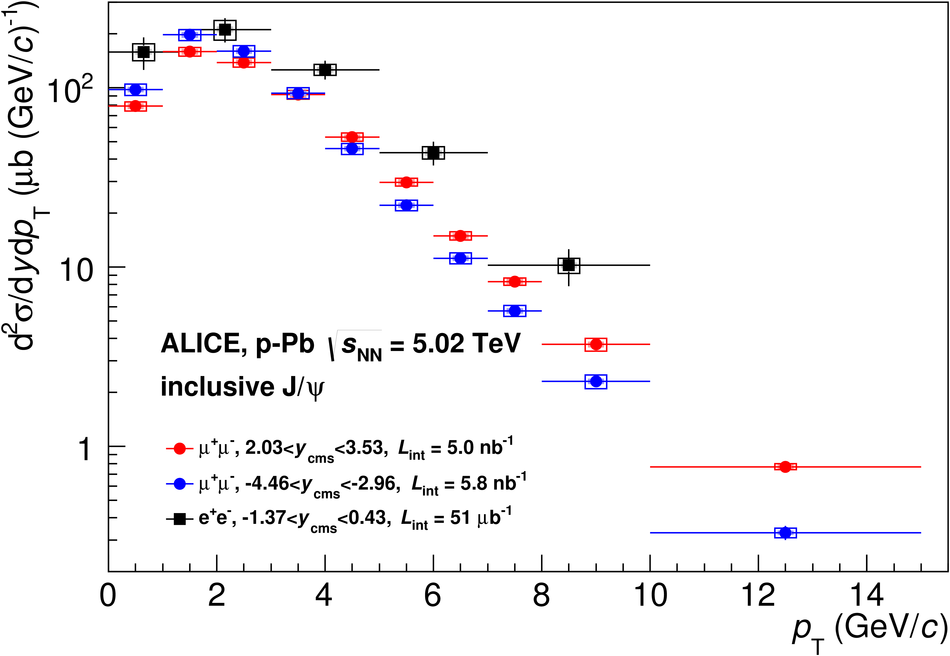
$p_{\rm T}$-differential inclusive $\rm J/\psi$ cross sections for the various rapidity regions under study The vertical error bars correspond to the statistical uncertainties, while open boxes represent the uncorrelated systematic uncertainties and the shaded boxes the quadratic sum of the fully and partially correlated ones. The numerical values can be read in Table 2 The horizontal bars correspond to the widths of the $p_{\rm T}$ bins.
|  |