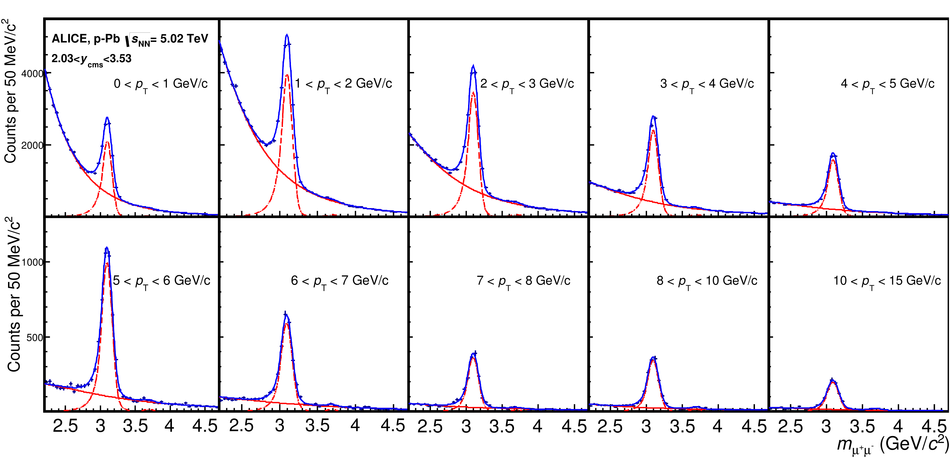
The opposite-sign dimuon invariant mass spectra for the various $p_{\rm T}$ bins, relative to the p--Pb data sample (blue symbols) The fits shown in this Figure (blue curves) were performed by using the sum of extended Crystal Ball functions for the $\rm J/\psi$ and $\psi(\rm{2S})$ signals, and a variable width Gaussian for the background. The signal and background components are shown separately as red curves.
|  |