Opposite-sign dielectron invariant massspectra (blue symbols) for various $p_{\rm T}$ intervals, compared to the background (black curve) estimated through mixed events The background is scaled to match the data in the mass ranges $2.0< m_{{\rm e}^+{\rm e}^-}< 2.5$ GeV/$c^2$ and $3.2< m_{{\rm e}^+{\rm e}^-}< 3.7$ GeV/$c^2$. | 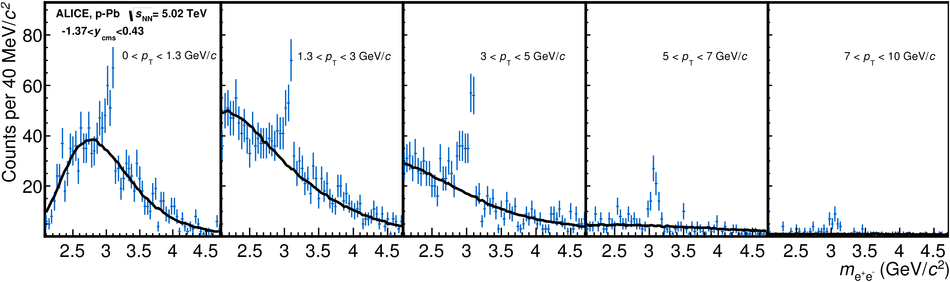 |