Invariant differential yields of deuterons and anti-deuterons in pp collisions at $\sqrt{s}$ = 0.9, 2.76 and 7 TeV and the yields of tritons, $^{3}$He nuclei and their anti-nuclei at $\sqrt{s}$ = 7 TeV have been measured with the ALICE detector at the CERN Large Hadron Collider. The measurements cover a wide transverse momentum ($p_{\text{T}}$) range in the rapidity interval $|y|<~0.5$, extending both the energy and the $p_{\text{T}}$ reach of previous measurements up to 3 GeV/$c$ for $A=2$ and 6 GeV/$c$ for $A=3$. The coalescence parameters of (anti-)deuterons and $^{3}\overline{\text{He}}$ nuclei exhibit an increasing trend with $p_{\text{T}}$ and are found to be compatible with measurements in pA collisions at low $p_{\text{T}}$ and lower energies. The integrated yields decrease by a factor of about 1000 for each increase of the mass number with one (anti-)nucleon. Furthermore, the deuteron-to-proton ratio is reported as a function of the average charged particle multiplicity at different center-of-mass energies.
Phys. Rev. C 97 (2018) 024615
HEP Data
e-Print: arXiv:1709.08522 | PDF | inSPIRE
CERN-EP-2017-255
Figure 1
Energy loss in the TPC ($\text{d}E/\text{d}x)$of particles with negative charge versus the rigidity estimated atthe TPC inner wall ($p_{\text{TPC}}/|Z|$). The solid lines representthe expected energy loss according to the parametrization of theBethe-Bloch formula. The blue circles and squares are $^{3}\overline{\text{He}}$nuclei and antitritons identified by the TPC only, and the orangecrosses and the red diamonds are the antitritons and $^{3}\overline{\text{He}}$nuclei, respectively, that were matched to a TOF detector hit. | 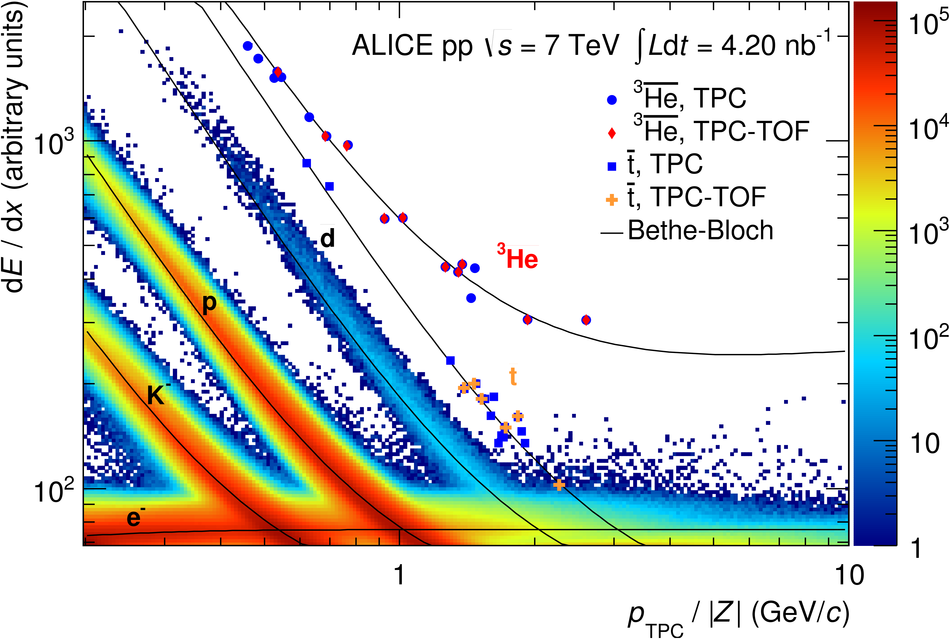 |

Figure 3
Mass distribution of antitriton (crosses) and$^{3}\overline{\text{He}}$ nucleus (diamonds) candidates obtainedwith the TOF detector as a function of the total momentum. The green and yellowbands represent 1$\sigma$ and 2$\sigma$ intervals, respectively, around the expected $^{3}$He mass(dashed line), obtained from the TOF resolution. | 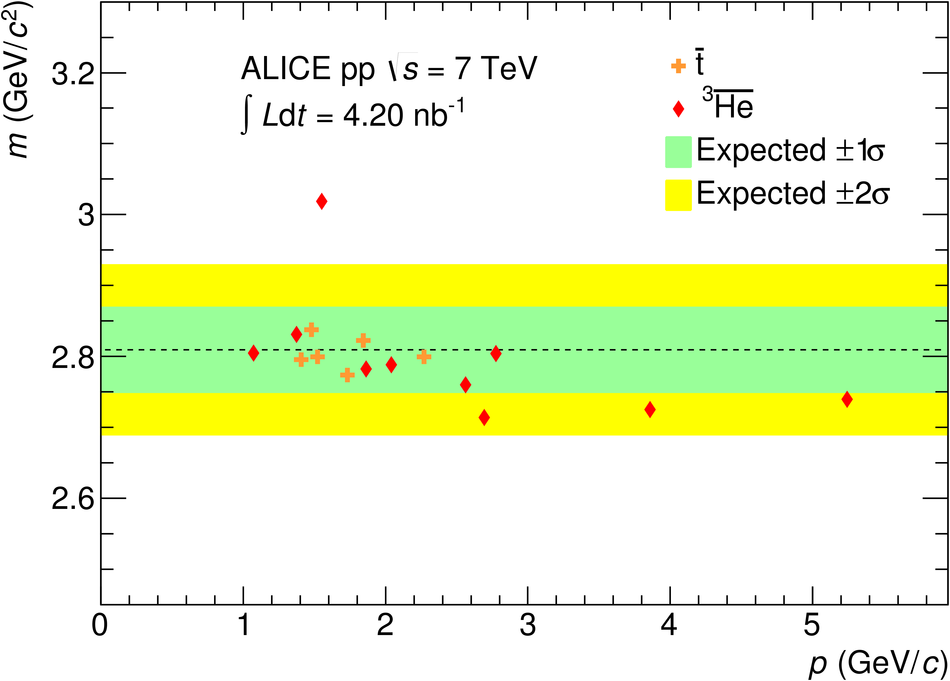 |
Figure 4
Distance of closest approach in the transverseplane to the primary vertex (DCA$_{xy}$) of deuterons (solid circles) and antideuterons (hollow circles) for the $p_{\text{T}}$ bins$0.8< p_{\text{T}}< 0.9$ GeV/$c$ (left) and $1.9< p_{\text{T}}< 2.0$ GeV/$c$(right). A large background distribution of secondary deuterons isclearly visible in the left panel. |  |
Figure 5
Invariant differential yield of deuterons(left panel) and antideuterons (right panel) in inelastic pp collisions (INEL)at $\sqrt{s}$ = 0.9, 2.76, and 7 TeV. Systematic uncertainties are representedby boxes and the data are multiplied by constant factors for clarity in the figure The lowest $p_{\text{T}}$ point for deuterons at $\sqrt{s}$ = 7 TeV was takenfrom . The dashed line represents the result of a fitwith a Tsallis function (see Sec. \ref{sub:yields-mean-pt} for details). |  |
Figure 6
Antideuteron-to-deuteron ratio ($\overline{\text{d}}/\text{d}$)as a function of $p_{\text{T}}$ per nucleon in pp collisions comparedwith the $(\overline{\text{p}}/\text{p})^{2}$ ratio (squares) atmid-rapidity ($|y|< 0.5$) . Boxes representthe systematic uncertainties and error bars in the $(\overline{\text{p}}/\text{p})^{2}$ ratiosare statistical and systematic uncertainties added in quadrature. | 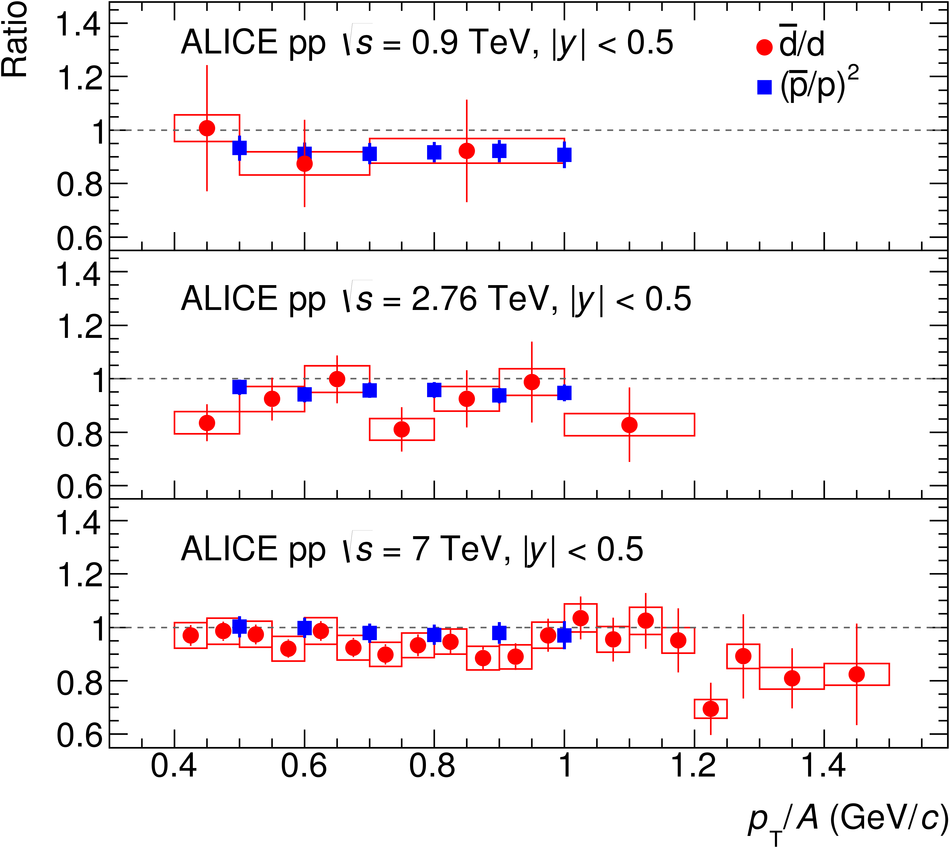 |
Figure 7
Invariant differential yields of tritonsand $^{3}$He nuclei (left panel) and their antinuclei (right panel)in inelastic pp collisions at $\sqrt{s}$ = 7 TeV Error bars and boxes represent the statistical and systematic uncertainties,respectively, and the dashed line the result of a fit with a Tsallis function(see Sec. \ref{sub:yields-mean-pt} for details). | 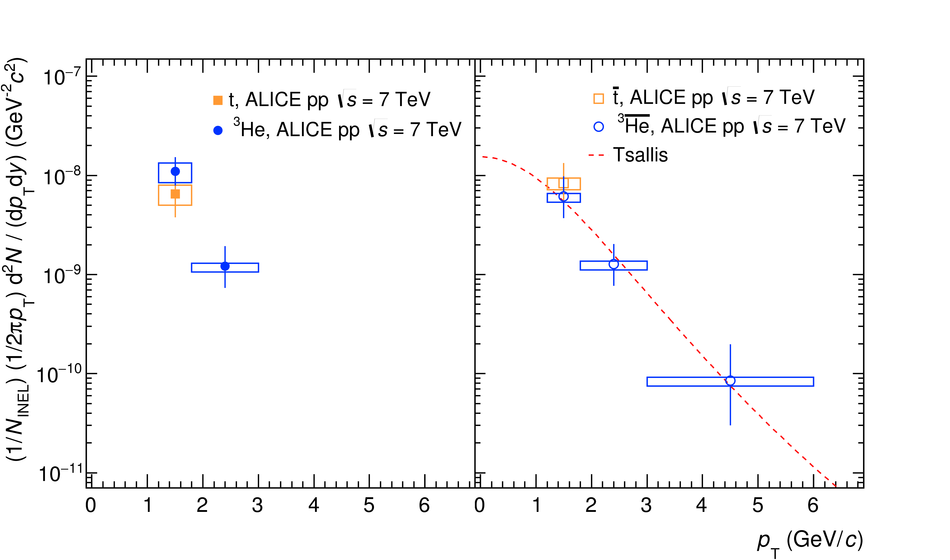 |
Figure 8
Coalescence parameter ($B_{2}$) of deuterons (solidcircles) and antideuterons (hollow circles) as a function of $p_{\text{T}}$per nucleon in inelastic pp collisions at $\sqrt{s}$ = 0.9, 2.76,and 7 TeV. Statistical uncertainties are represented by error bars andsystematic uncertainties by boxes. | 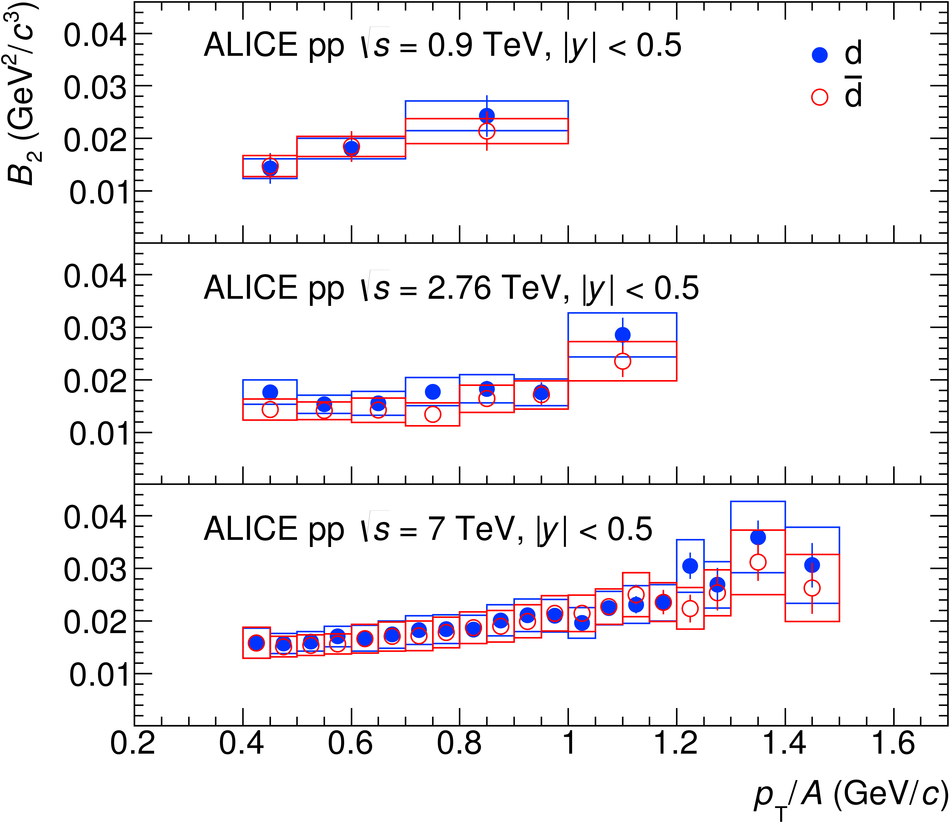 |
Figure 9
Coalescence parameter ($B_{2}$) of antideuteronsin inelastic pp collisions at $\sqrt{s}$ = 7 TeV (circles) comparedwith the values measured at lower energies in pp , $\upgamma$p , ep (squares and hollow circles), and in p--Cu and p--Pb collisions (band at $p_{\text{T}}/A$ = 0 GeV/$c$). |  |
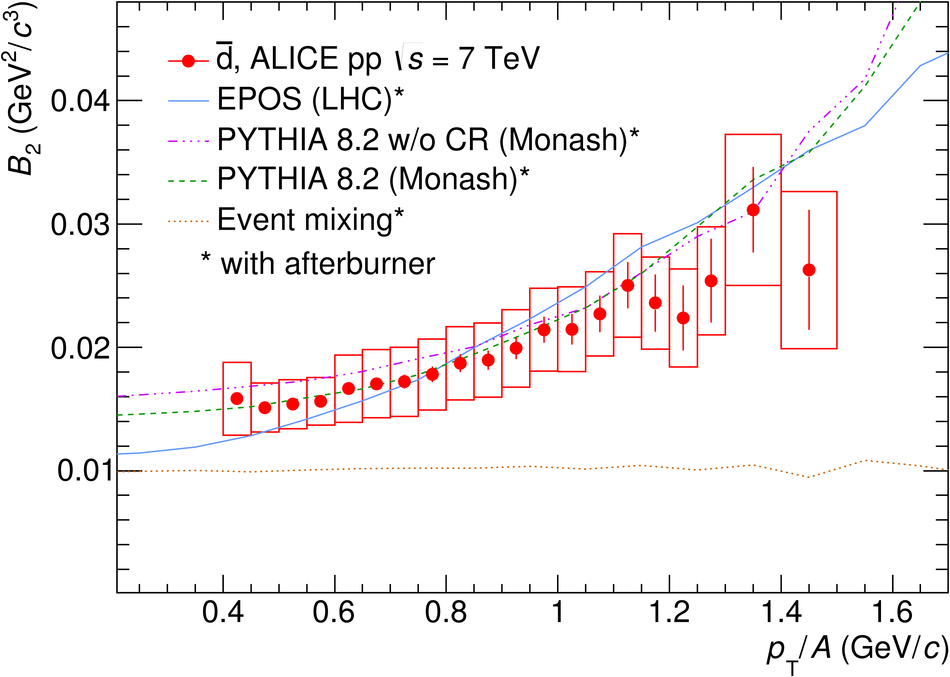
Figure 11
Coalescence parameter ($B_{3}$) of tritons and $^{3}$Henuclei (left panel) and their antinuclei (right panel) in inelasticpp collisions at $\sqrt{s}$ = 7 TeV. The Bevalac measurements in p--C, p--Cu,and p--Pb collisions are not given as a function of $p_{\text{T}}$and are shown as vertical bands at $p_{\text{T}}/A$ = 0 GeV/$c$ for comparison Error bars and boxes represent the statistical and systematic uncertainties,respectively, and dashed lines the values obtained with EPOS (LHC) withthe afterburner. | 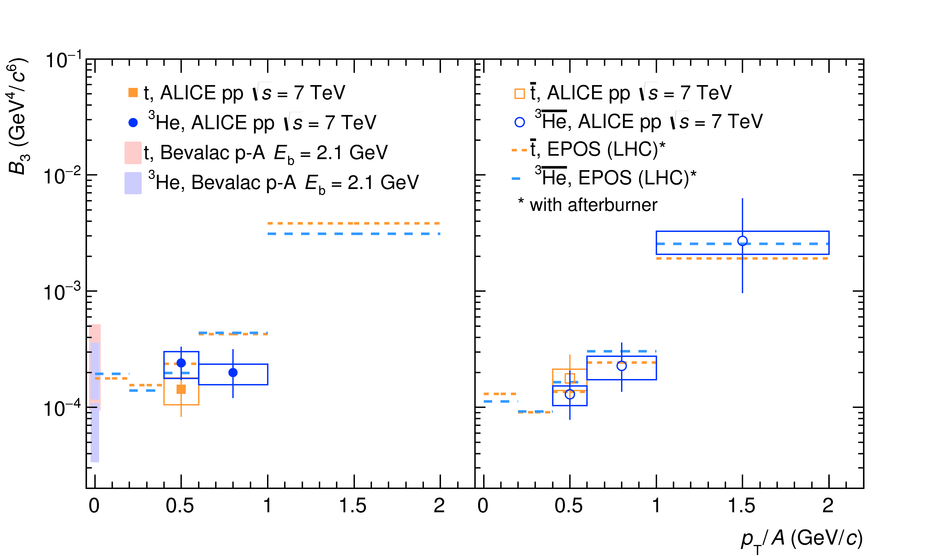 |
Figure 12
Integrated yields ($\text{d}N/\text{d}y$) of antiprotons,antideuterons and $^{3}\overline{\text{He}}$ nucleias a function of the number of antinucleons in inelastic pp collisionsat $\sqrt{s}$ = 7 TeV. The horizontal lines represent a fit with the function$c_{0}Ac_{1}^{A}$ based on Eq. (\ref{eq:BA}). | 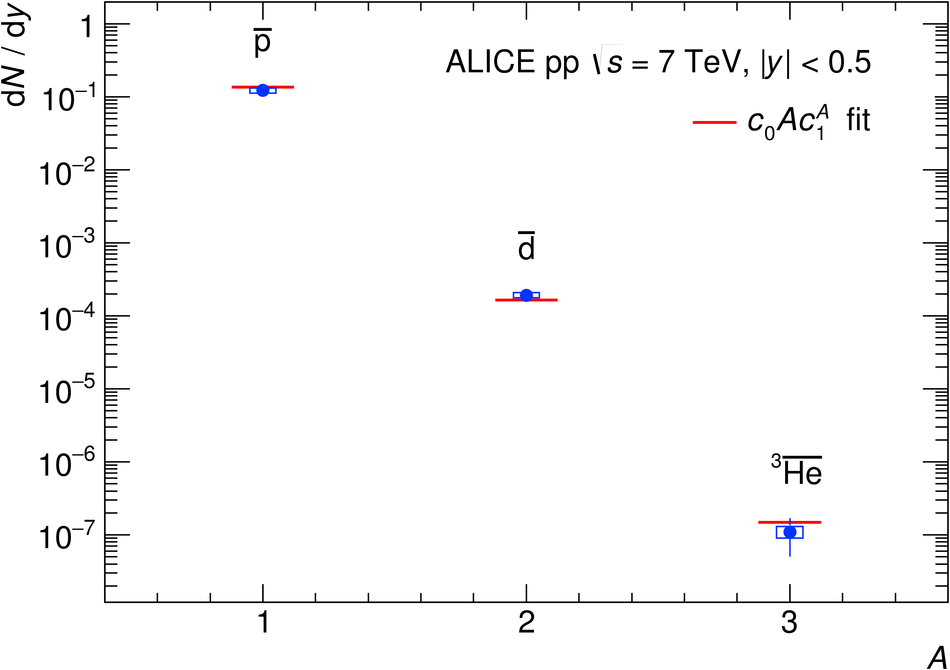 |
Figure 13
Integrated deuteron-to-proton (d/p) and antideuteron-to-antiproton ($\overline{\text{d}}/\overline{\text{p}}$)ratios in inelastic pp collisions as a function of the averagecharged particle multiplicity for different center-of-mass energies The average d/p ratio in AA collisions lies two times above the highest value in pp collisions (not shown). Dashed and solid lines represent the expected values from EPOS (LHC) with afterburner and the bands their uncertainties The CERN ISR value is corrected by the contribution of feed-downantiprotons estimated with an EPOS (LHC) simulation. |  |