Comparison of the measured nuclear modification factor $R_{\rm{AA}}$ with a GLV calculation and with a WHDG parton energy loss calculations. Vertical lines show the statistical uncertainties, systematic uncertainties are shown as boxes. Horizontal lines indicate the bin width. The boxes around unity reflect the scale uncertainties of data related to $T_{AA}$ and the normalization of the pp spectrum. | 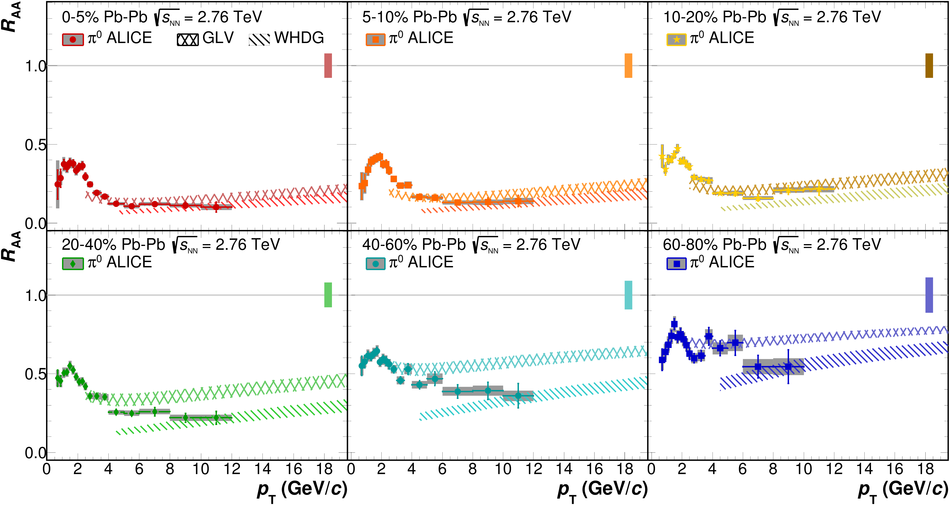 |