Invariant yields of neutral pions at midrapidity in the transverse momentum range $0.6 <~ p_{T} <~ 12 GeV/c$ measured in Pb-Pb collisions at $\sqrt{s_{\rm NN}} = 2.76$ TeV are presented for six centrality classes. The pp reference spectrum was measured in the range $0.4 <~ p_{T} <~ 10 GeV/c$ at the same center-of-mass energy. The nuclear modification factor, $R_{\rm AA}$, shows a suppression of neutral pions in central Pb-Pb collisions by a factor of up to about $8-10$ for $5 \lesssim p_{T} \lesssim 7 GeV/c$. The presented measurements are compared with results at lower center-of-mass energies and with theoretical calculations.
Eur. Phys. J. C 74 (2014) 3108
HEP Data
e-Print: arXiv:1405.3794 | PDF | inSPIRE
CERN-PH-EP-2014-091
Figure 1
Invariant mass spectra in selected $pT$ slices for PCM (upper row) and PHOS (lower row) in the $\pi^0$ mass region for pp (left column), $60-80\%$ (middle column) and $0-10\%$ (right column) Pb-Pb collisions. The histogram and the filled points show the data before and after background subtraction, respectively. For the $0-10\%$ class the invariant mass distributions after background subtraction were scaled by a factor 15 and 5 for PCM and PHOS, respectively, for better visibility of the peak. The positions and widths of the $\pi^0$ peaks were determined from the fits, shown as blue curves, to the invariant mass spectra after background subtraction.
|  |
Figure 2
Reconstructed $\pi^0$ peak width (upper row) and position (lower row) as a function of $p_{\rm T}$ in pp collisions at $\sqrt{s}= 2.76{TeV}$ (a, d), peripheral (b, e) and central (c, f) Pb-Pb collisions at $\snn = 2.76{TeV}$ in PHOS and in the photon conversion method (PCM) compared to Monte Carlo (MC) simulations. The horizontal line in (d, e, f) indicates the nominal $\pi^0$ mass.
|  |
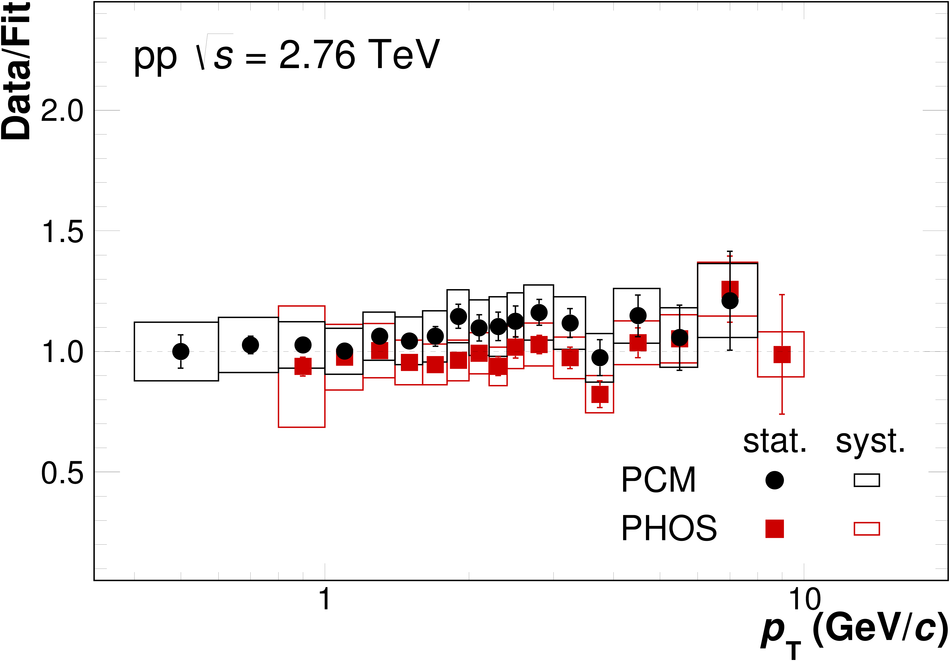
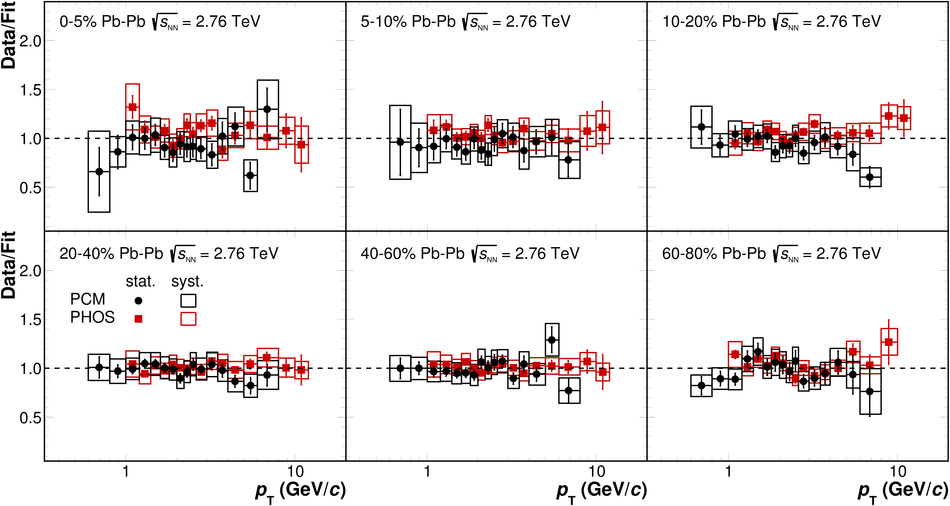
Figure 5
Invariant differential yields of neutral pions produced in Pb-Pb and inelastic pp collisions at $\snn= 2.76 {TeV}$. The spectra are the weighted average of the PHOS and the PCM results. The vertical lines show the statistical uncertainties, systematic uncertainties are shown as boxes. Horizontal lines indicate the bin width. The horizontal position of the data points within a bin was determined by the procedure described in For the pp spectrum a fit with a power law function $1/p_{\rm T}^n$ for $p_{\rm T} > 3 {GeV}/c$ and a Tsallis function (also used in ) are shown. The extrapolation of the pp spectrum provided by the Tsallis fit is used in the $R_{\rm{AA}}$ calculation for $p_{\rm T} \gtrsim 8 {GeV}/c$.
|  |
Figure 6
Ratio of data or theory calculations to a fit of the neutral pion spectrum in pp collisions at $\snn = 2.76 {TeV}$. The renormalization, factorization, and fragmentation scale of the next-to-leading order QCD calculation were varied simultaneously ($\mu = 0.5 p_{\rm T}$, $p_{\rm T}$, $2 p_{\rm T}$). The calculation employed the CTEQ6M5 parton distribution functions and the DSS fragmentation function . The solid red line is a comparison to the PYTHIA 8.176 (tune 4C) event generator . | 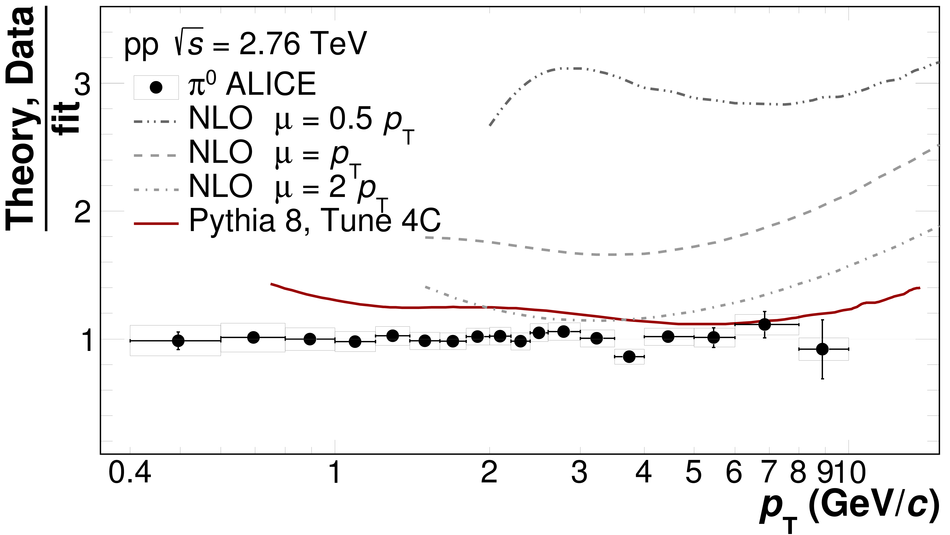 |
Figure 7
Neutral pion nuclear modification factor $R_{\rm{AA}}$ for three different centralities ($0-5\%$, $20-40\%$, $60-80\%$) in Pb-Pb collisions at $\snn = 2.76 {TeV}$. Vertical error bars reflect statistical uncertainties, boxes systematic uncertainties. Horizontal bars reflect the bin width. The boxes around unity reflect the uncertainty of the average nuclear overlap function ($T_{AA}$) and the normalization uncertainty of the pp spectrum added in quadrature. | 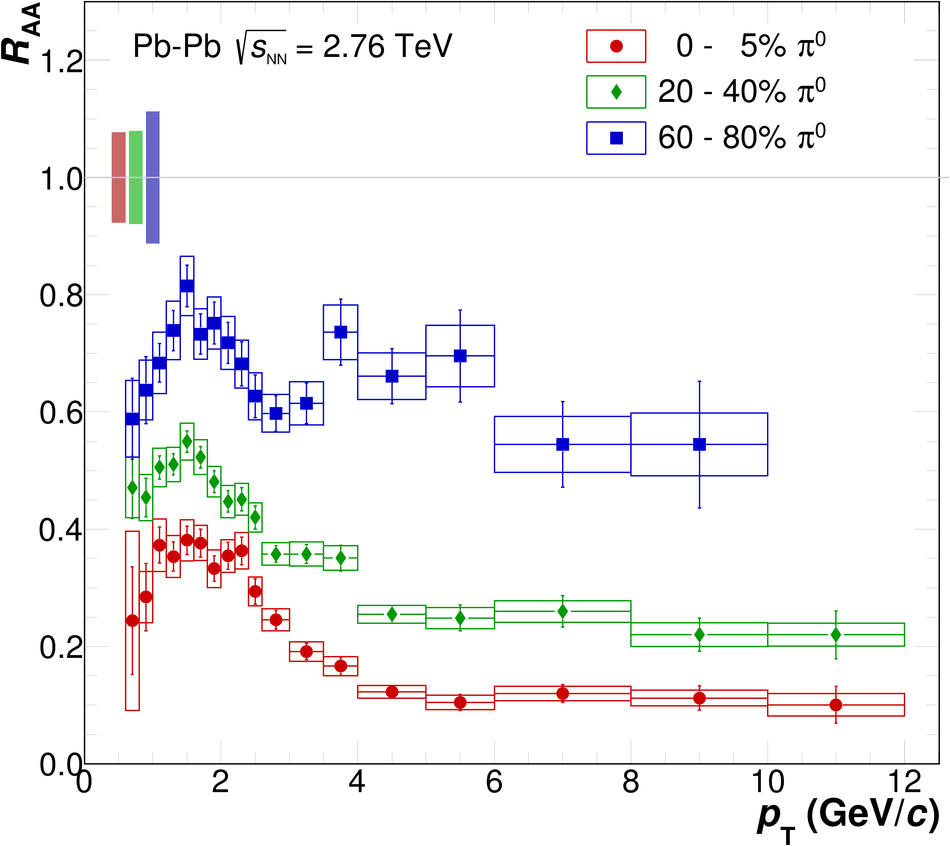 |
Figure 8
Neutral pion nuclear modification factor, $R_{\rm{AA}}$, in Pb-Pb collisions at $\snn = 2.76 {TeV}$ for the $0-10\%$ class in comparison to results at lower energies. The box around unity reflects the uncertainty of the average nuclear overlap function ($T_{AA}$) and the normalization uncertainty of the pp spectrum added in quadrature. Horizontal bars reflect the bin width. The center-of-mass energy dependence of the neutral pion $R_{\rm{AA}}$ is shown with results from Au-Au collisions at $\snn = 39$, $62.4$ , and $ 200 {GeV}$ as well as the result from the CERN SPS (using scaled p-C data as reference) along with the results for Pb-Pb at $\snn = 2.76 {TeV}$. The scale uncertainties of the measurements at lower energies of the order of $10-15\%$ are not shown.
| 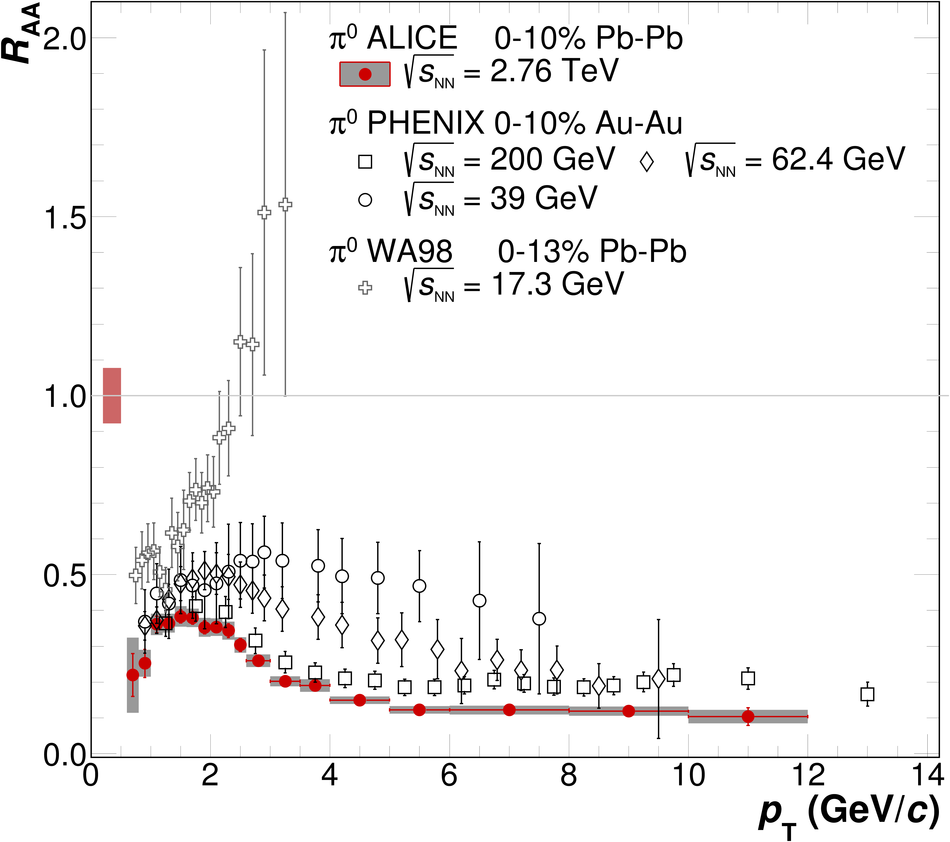 |
Figure 10
Comparison of the measured nuclear modification factor $R_{\rm{AA}}$ with a GLV calculation and with a WHDG parton energy loss calculations. Vertical lines show the statistical uncertainties, systematic uncertainties are shown as boxes. Horizontal lines indicate the bin width. The boxes around unity reflect the scale uncertainties of data related to $T_{AA}$ and the normalization of the pp spectrum. | 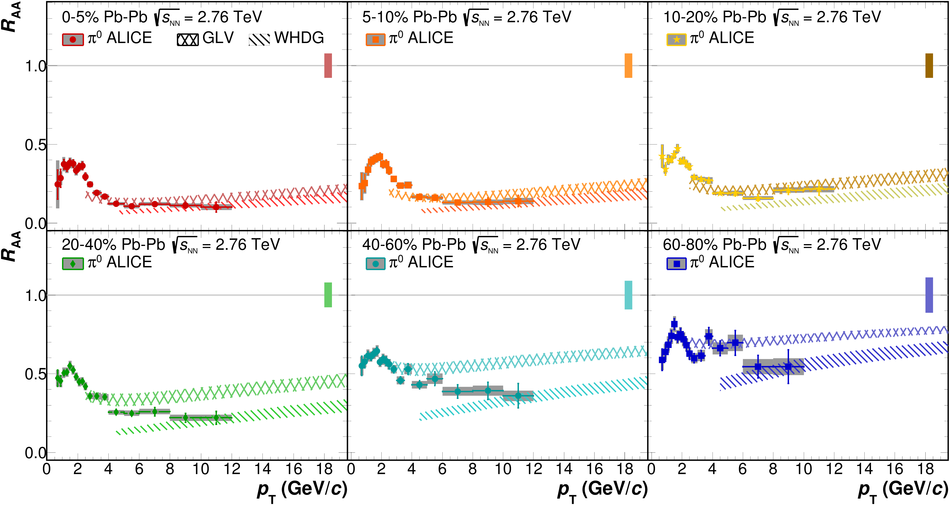 |
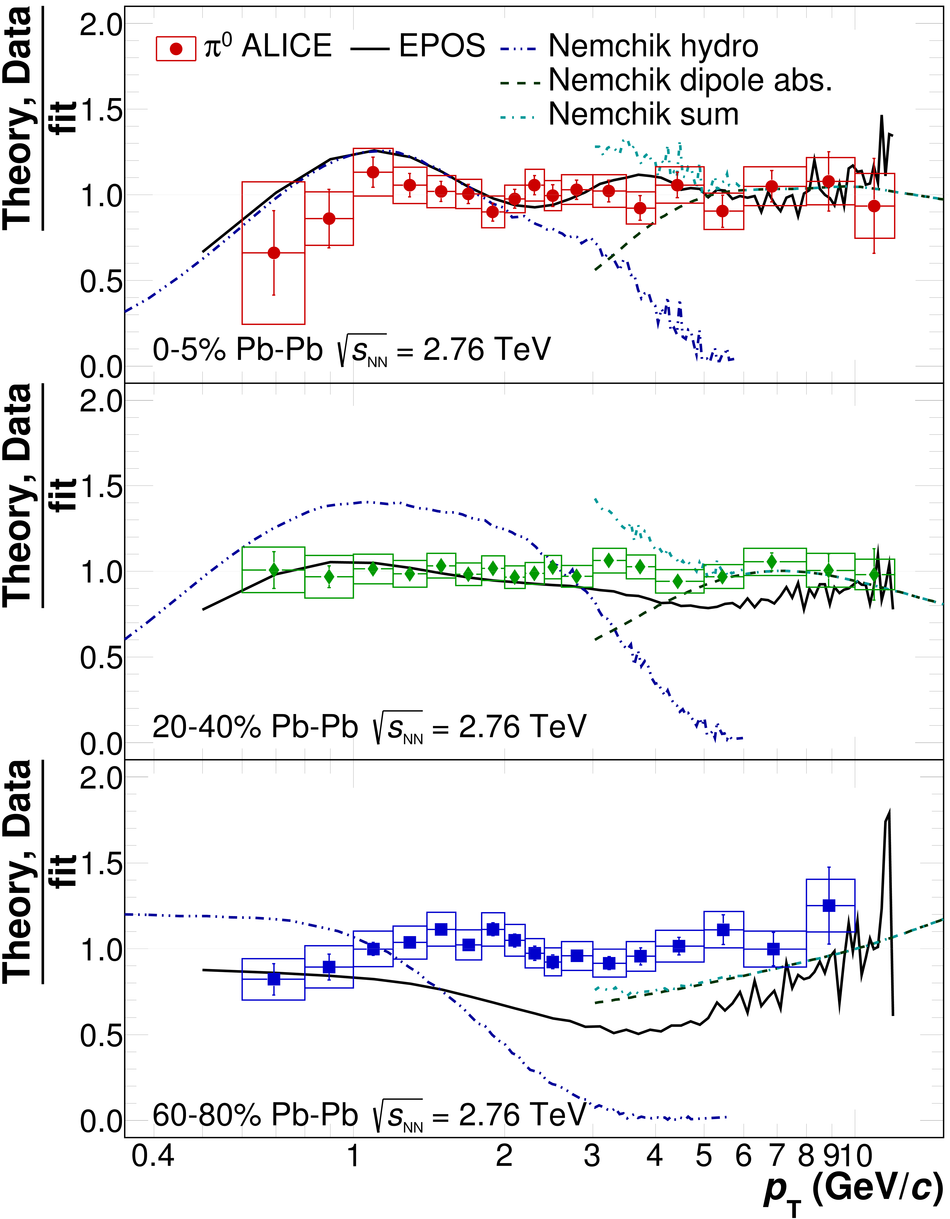
Figure 11
Comparison of the measured $\pi^0$ spectra for three centrality classes ($0-5\%$, $20-40\%$, $60-80\%$) with two calculations which make predictions for the full $p_{\rm T}$ range of the measurement. The calculated spectra and the data points were divided by a fit of the measured $\pi^0$ spectra. For the data points the error bars represent the statistical uncertainties and the boxes the systematic uncertainties. Calculations with the EPOS event generator are shown by the solid line. The fluctuations of the EPOS lines at high $p_{\rm T}$ are due to limited statistics in the number of generated events. The calculations by Nemchik et al. combine a hydrodynamical model at low $p_{\rm T}$ with a color dipole absorption model for $p_{\rm T} \gtrsim 3 {GeV}/c$. The two components and the sum (for $p_{\rm T} \gtrsim 3 {GeV}/c$) are shown separately.
|  |