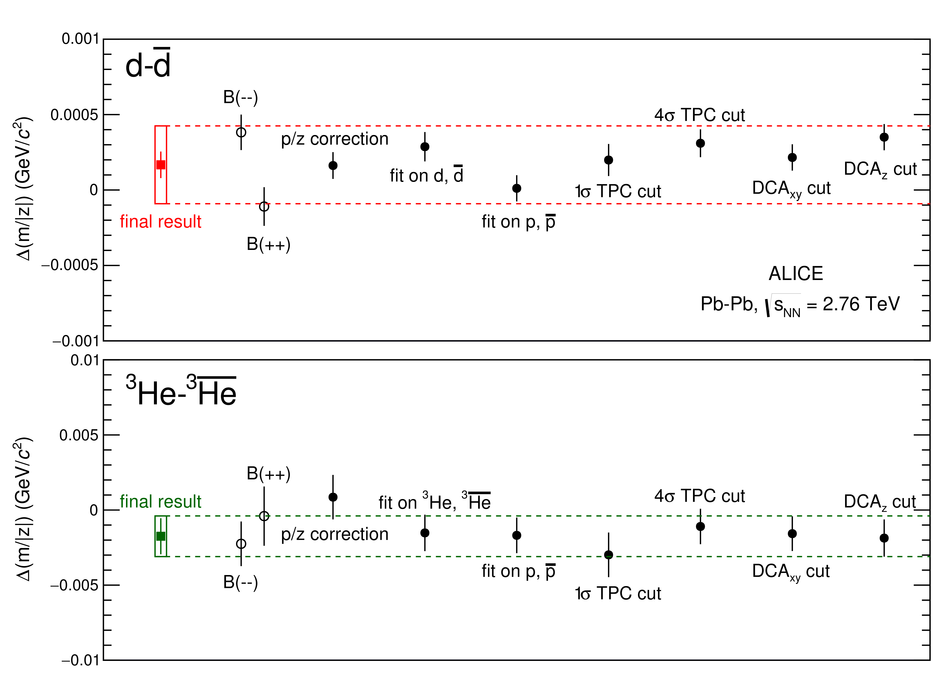
Distribution of the mass-over-charge ratio difference measurements of d-$\rm{\overline{d}}$ (top) and $\rm{^{3}He}$-$\rm{^{3}\overline{He}}$ (bottom) obtained in the positive and negative magnetic field configurations (black open points labelled as B(++) and B(--), respectively), by removing the mean rigidity corrections, by varying the fit strategy for (anti-)nuclei and (anti-)protons, the particle selection in the TPC and the requirement on the DCA in the transverse plane and along the beam direction ($\rm{DCA_{xy}}$ and $\rm{DCA_{z}}$, respectively) These are compared to the final result (red and green squares), shown with its statistical uncertainty (vertical bar) and its systematic uncertainty expressed as standard deviation (open box)
|  |