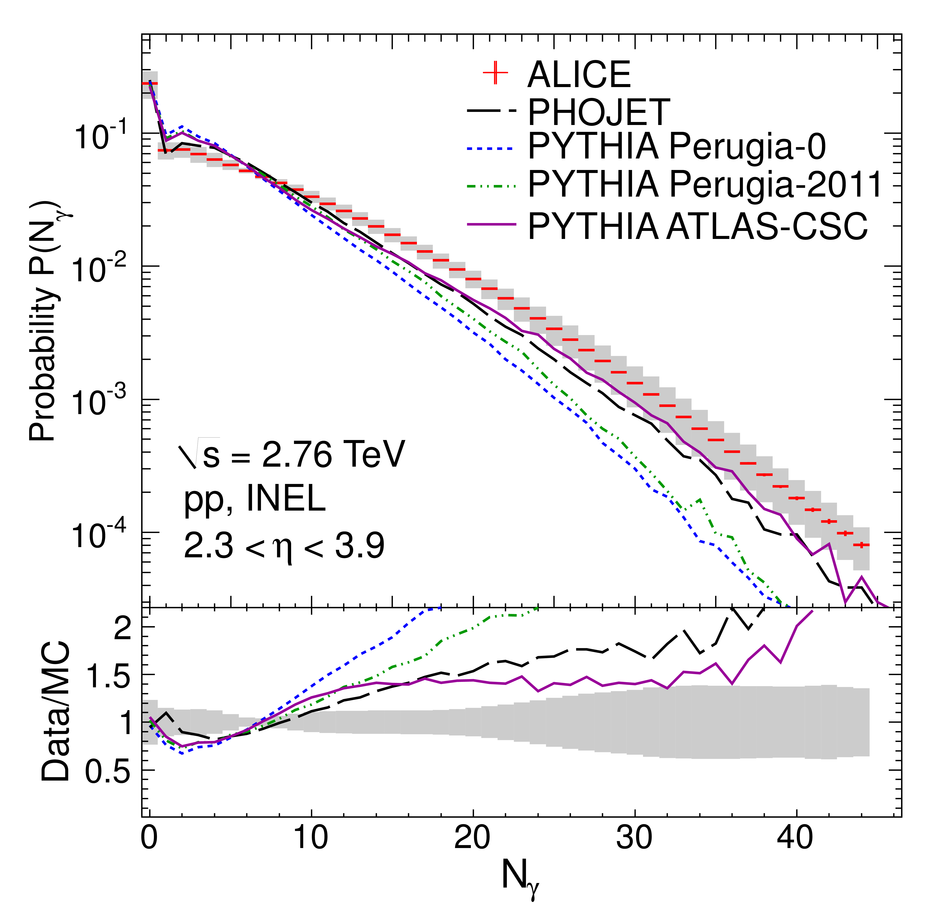
Multiplicity distributions of photons within $2.3 < \eta < 3.9$ forinelastic eventsin pp collisions at $\sqrt{s}$ = 0.9 (top), 2.76 (middle)and 7 TeV (bottom). Predictions from differentevent generators are superimposed. Lower panelsshow the ratios between the data and MC distributions The error bars are statisticaland the shaded regions represent the systematicuncertainties | 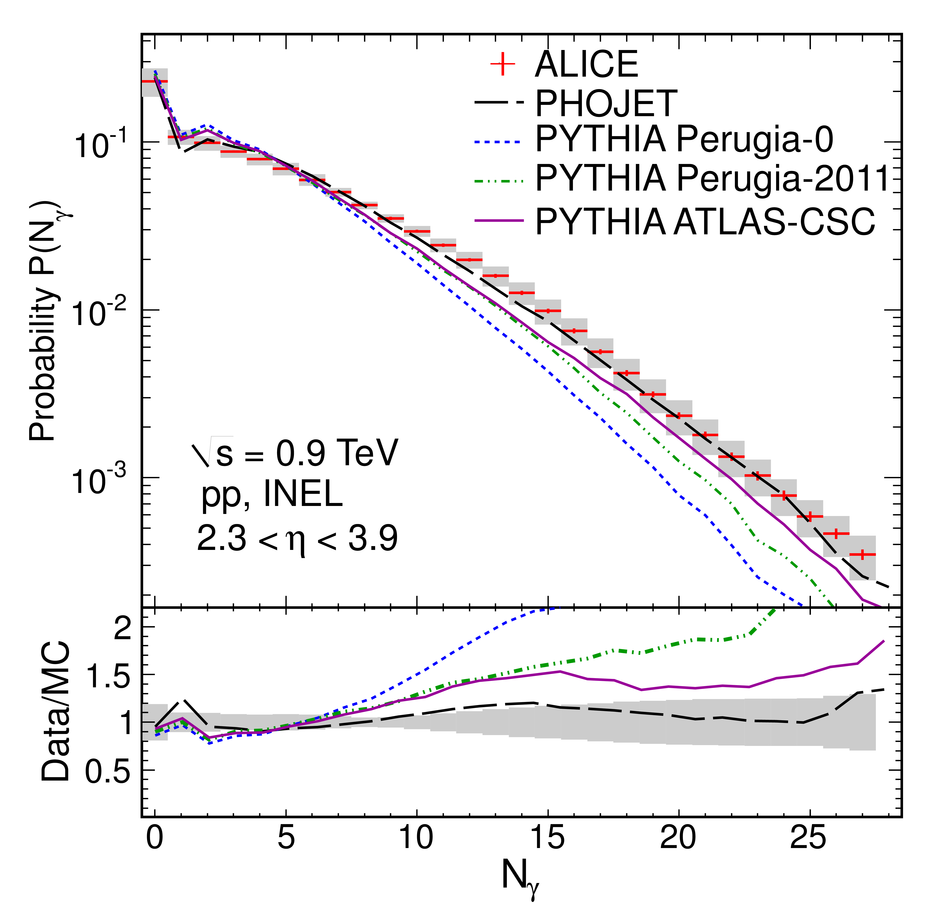 |