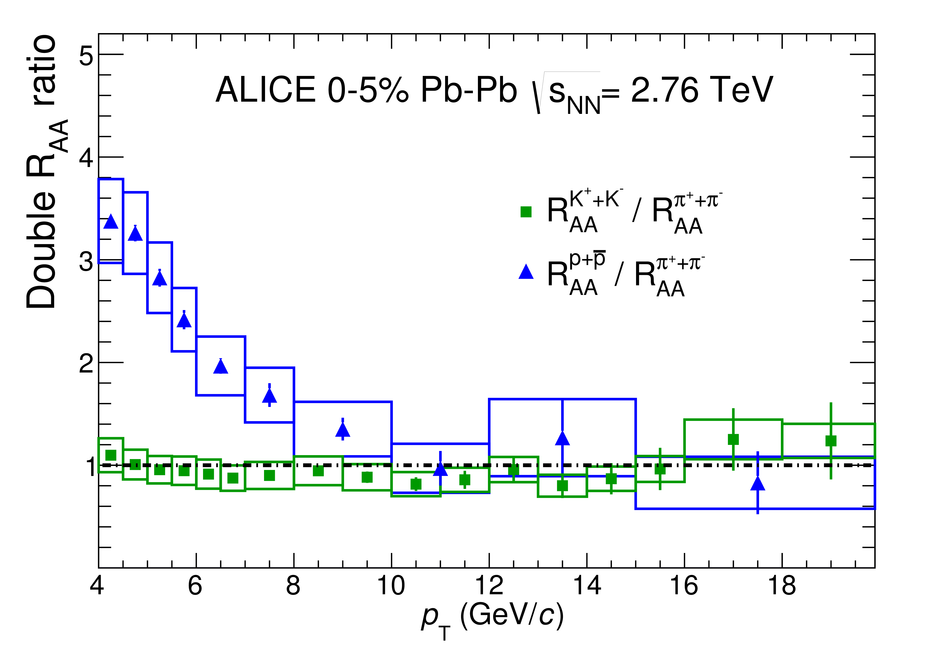
Transverse momentum spectra of $\pi^{\pm}$, $\rm K^{\pm}$ and p($\bar{\rm p}$) up to $p_{\rm T}$ = 20 GeV/$c$ at mid-rapidity in pp and Pb-Pb collisions at $\sqrt{s_{\rm NN}}=$ 2.76 TeV have been measured using the ALICE detector at the Large Hadron Collider. The proton-to-pion and the kaon-to-pion ratios both show a distinct peak at $p_{\rm T} \approx 3 GeV/c$ in central Pb-Pb collisions. Below the peak, $p_{\rm T}$ < 3 GeV/$c$, both ratios are in good agreement with hydrodynamical calculations, suggesting that the peak itself is dominantly the result of radial flow rather than anomalous hadronization processes. For $p_{\rm T}$ > 10 GeV/$c$ particle ratios in pp and Pb-Pb collisions are in agreement and the nuclear modification factors for $\pi^{\pm}$, $\rm K^{\pm}$ and $\rm p$($\bar{\rm p}$) indicate that, within the systematic and statistical uncertainties, the suppression is the same. This suggests that the chemical composition of leading particles from jets in the medium is similar to that of vacuum jets.
PLB 736 (2014) 196-207
HEP Data
e-Print: arXiv:1401.1250 | PDF | inSPIRE
CERN-PH-EP-2013-230

Figure 2
$\rm{d}E/\rm{d}x$ distributions measured for $|\eta| < 0.2$ and normalized to the integrated yields. The signals are fitted to a sum of four Gaussian functions (solid line). Two $p$ intervals are shown for central (left) and peripheral (center) Pb-Pb and pp (right) collisions. In all momentum intervals the electron fraction is below $1\%$ (not visible). Individual yields are shown as dashed curves; protons in blue (left), kaons in green, and pions in red (right). | 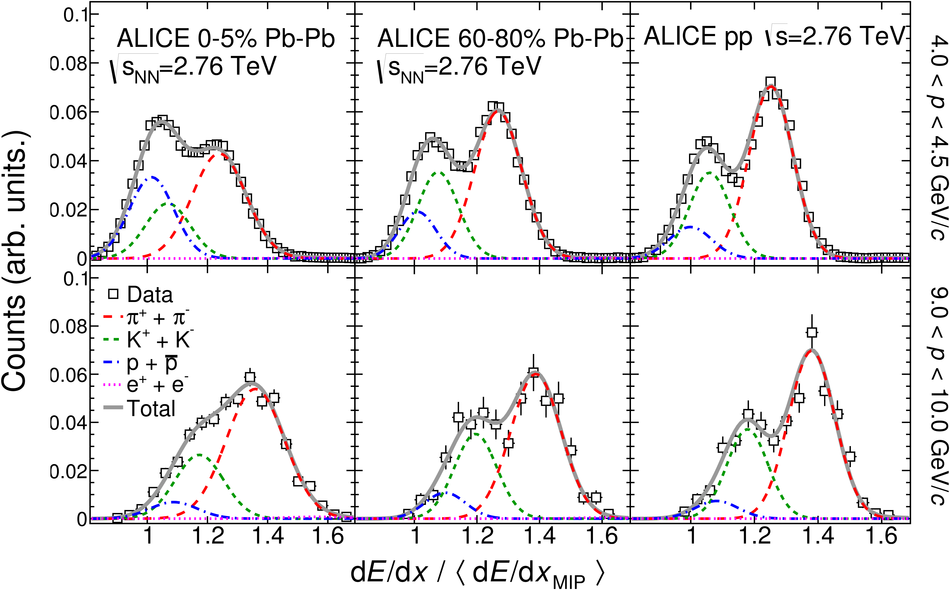 |
Figure 3
The ratio of individual spectra to the combined spectrum as a function of $\pt$ for pions (top), kaons (center), and protons (bottom). Only the $\pt$-range where the analyses overlap is shown. The ITS+TPC+TOF spectra are the results published in $Phys.Rev.C88,044910(2013)$. The statistical and independent systematic uncertainties are shown as vertical error bars and as a band, respectively, and only include those on the individual spectra. | 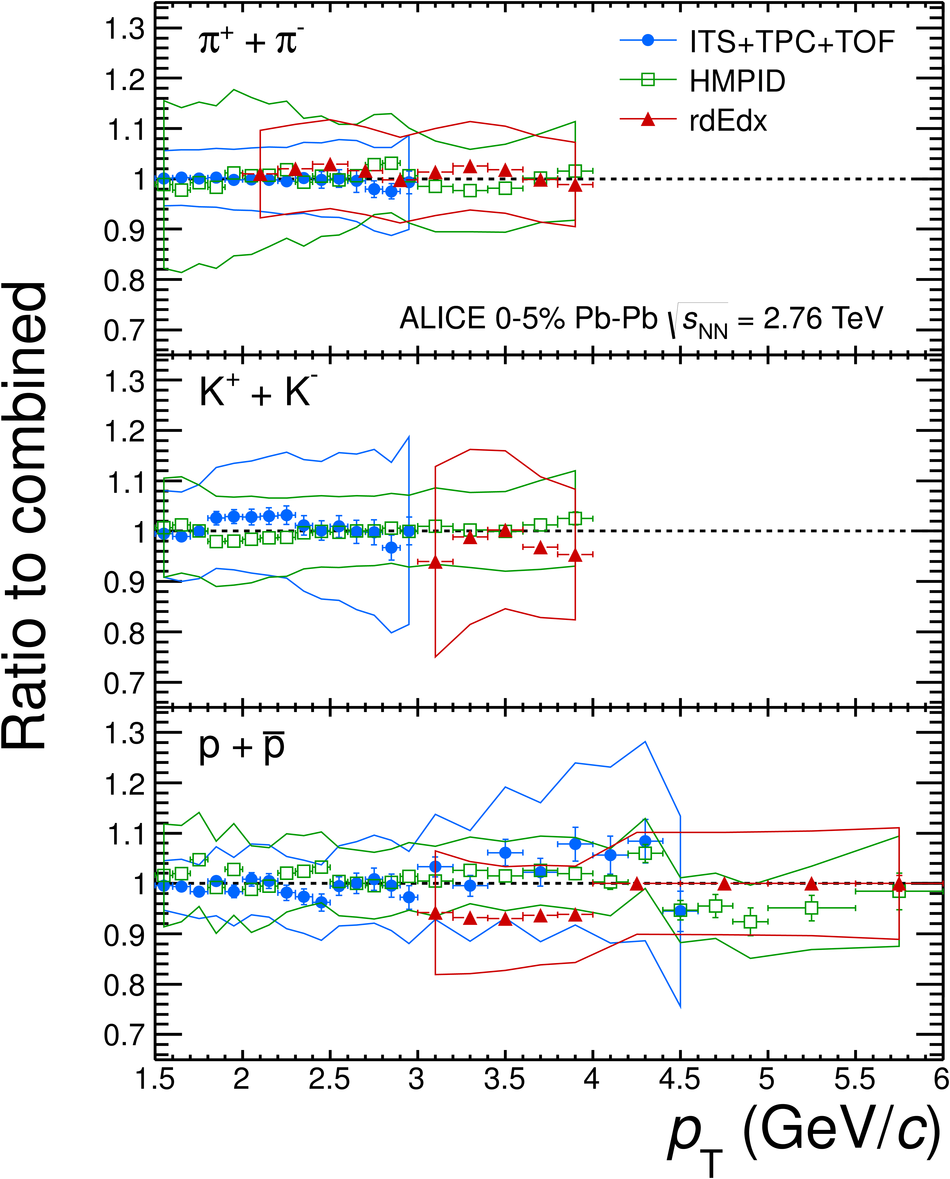 |
Figure 4
Solid markers show the invariant yields of identified particles in central (circles) and peripheral (squares) Pb-Pb collisions. Open points show the pp reference yields scaled by the average number of binary collisions for $0-5\%$ (circles) and $60-80\%$ (squares) [$Phys. Rev. C 88, 044909 (2013)$]. The statistical and systematic uncertainties are shown as vertical error bars and boxes, respectively. | 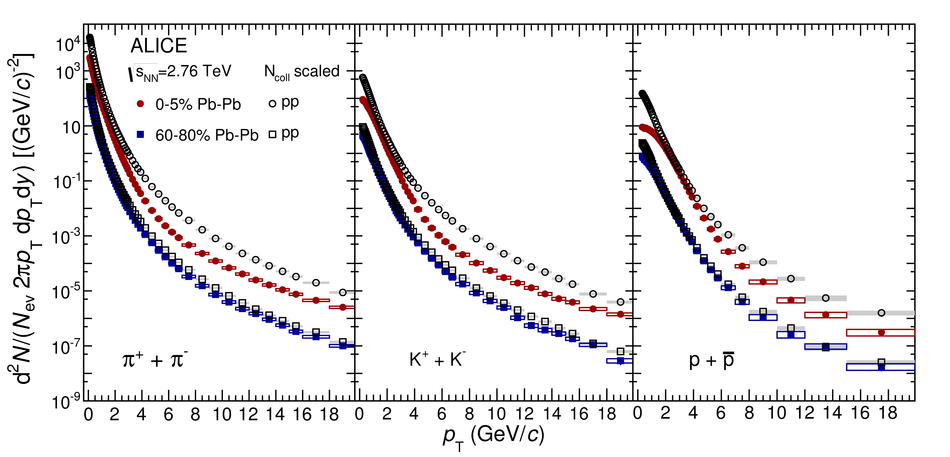 |
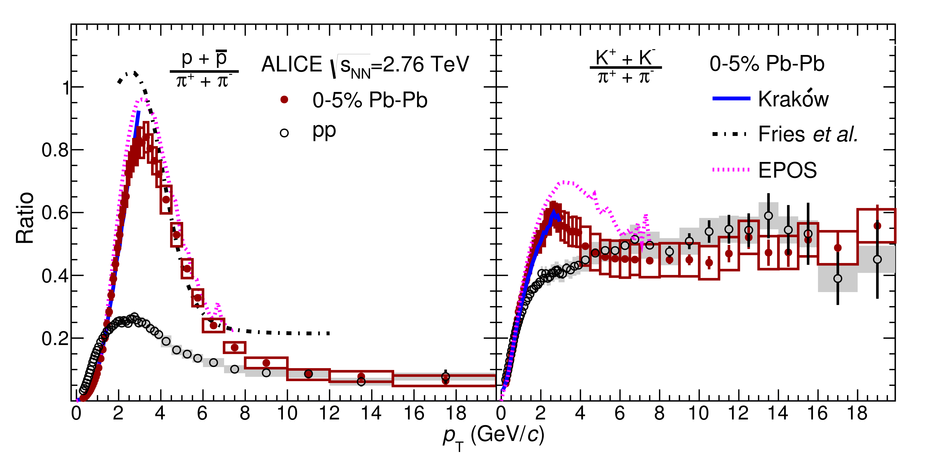
Figure 6
The nuclear modification factor $\Raa$ as a function of $\pt$ for different particle species. Results for $0-5\%$ (left) and $60-80\%$ (right) collision centralities are shown. Statistical and systematic uncertainties are plotted as vertical error bars and boxes around the points, respectively. The total normalization uncertainty (pp and PbPb) is indicated by the black boxes in the top panels [$Phys. Lett. B 720, 52 (2013)$]. | 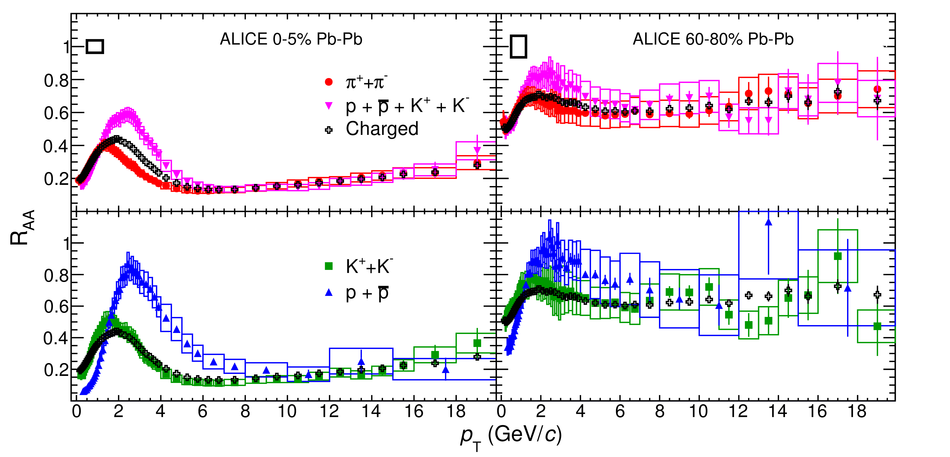 |