Top panel: number of uncorrelated seeds as a function of the midrapidity charged particle multiplicity. Shown are results for two $\pt$ cuts: 0.7 GeV/$c$ $< p_{\rm T,assoc} < p_{\rm T,trig} < $ 5.0 GeV/$c$ (red circles) and 2.0 GeV/$c$ $< p_{\rm T,assoc} < p_{\rm T,trig} < $ 5.0 GeV/$c$ (black squares). Each of them is fit with a linear function in the 0-50% multiplicity classes; open symbols are not included in the fit. Statistical (lines) and systematic uncertainties (boxes) are shown, even though the statistical ones are smaller than the symbol size Bottom panel: ratio between the number of uncorrelated seeds and the linear fit functions. Black points are displaced slightly for better visibility. | 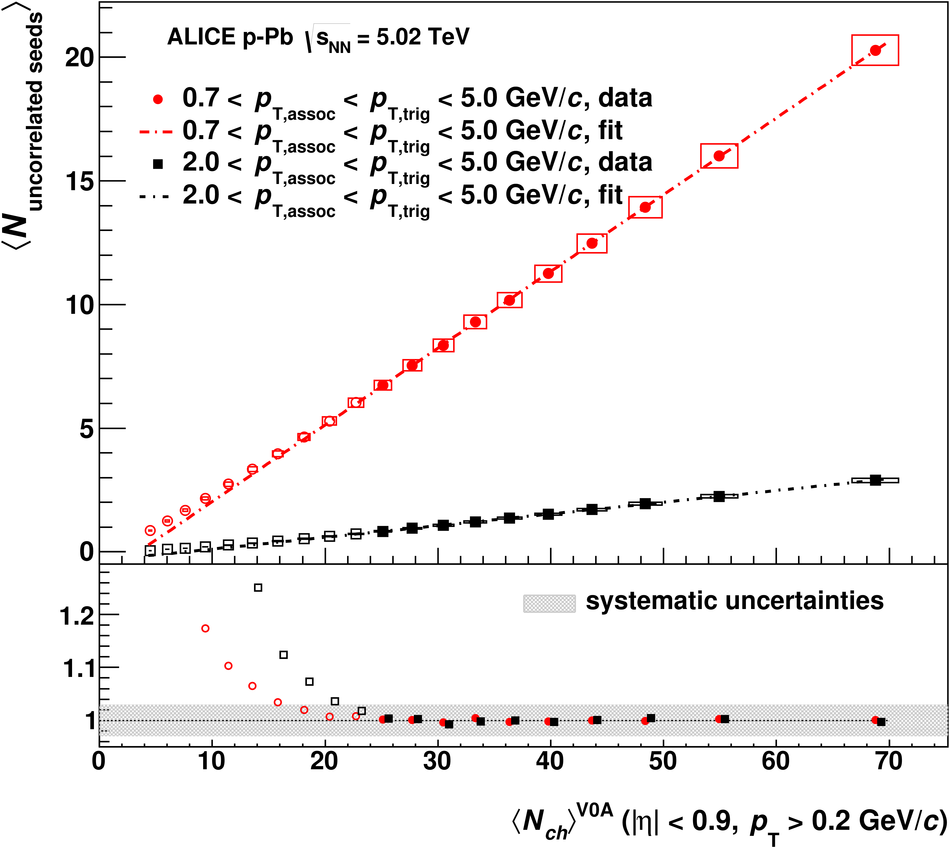 |