Instantaneous rate (top) and number of collected events (bottom) for selected triggers in the running periods from 2010 to 2013. Special running periods (Pb-Pb, p-Pb, low energy pp) are indicated by shaded areas; the rest represents pp runs at the highest available energy. | 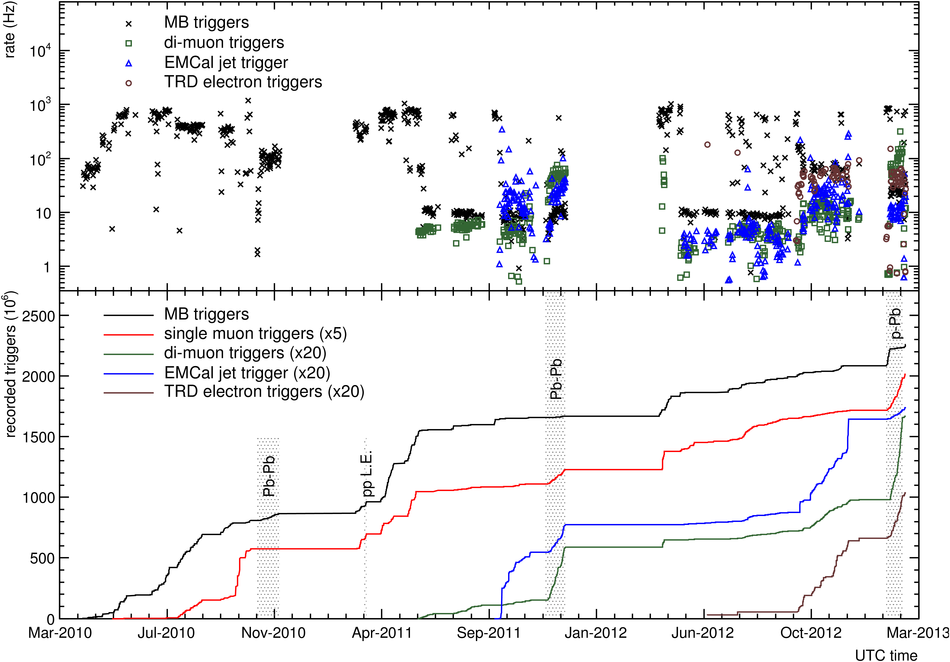 |
