The $Ω^-$ baryon, composed of three strange quarks (sss), was predicted by the quark model and discovered in 1964, playing a pivotal role in establishing quarks as fundamental constituents of matter. Despite its importance, experimental knowledge of its mass remains limited, with the current world average relying on measurements performed more than four decades ago and lacking robust estimates of systematic uncertainties. This is notable given the central role of the $Ω^-$ mass, and alternatively that of the $Ξ^-$(dss), in lattice QCD calculations, where it is widely used to set the overall physical scale. Precise scale setting is essential for first-principles studies of quark confinement, chiral symmetry breaking, and stringent tests of the Standard Model. Here we report high-precision measurements of the masses of the $Ω^-$ and $Ξ^-$ baryons and their antiparticles, determined from invariant-mass reconstruction of their decay products in proton$-$proton collisions at the LHC. The analysis exploits the excellent tracking and particle-identification capabilities of the ALICE experiment, enabling accurate reconstruction of the displaced decay vertices characteristic of these short-lived particles. Each mass is measured with a fractional uncertainty of about 60 parts per million, for example $M_{\barΩ^+}=1672.558\,\pm\,0.034\,({\rm stat.})\,\pm\,0.102\,({\rm syst.})$ MeV/$c^2$. The precisely known K$^0_{\rm S}$ and $Λ$ masses are used for calibration. These results establish new precision benchmarks in strange-baryon spectroscopy and enable stringent tests of Charge-Parity-Time invariance in the multistrange-hadron sector. Our measurement reduces the scale uncertainty in lattice QCD calculations, enabling for instance sub per mille precision for the hadronic vacuum-polarization contribution to the muon anomalous magnetic moment.
Submitted to: OTHERS
e-Print: arXiv:2606.20144 | PDF | inSPIRE
CERN-EP-2026-174
Figure group
Figure 1
A typical $\Oms$ decay in the ALICE detector, with the 6 silicon layers of ITS, with the active detector elements in red and support structures in grey. The trajectories of the $\Oms$, $\plam$, kaon, proton and pion trajectories are indicated with borders in light blue, light green (dashed line), light violet, olive-green and red-orange, respectively. | 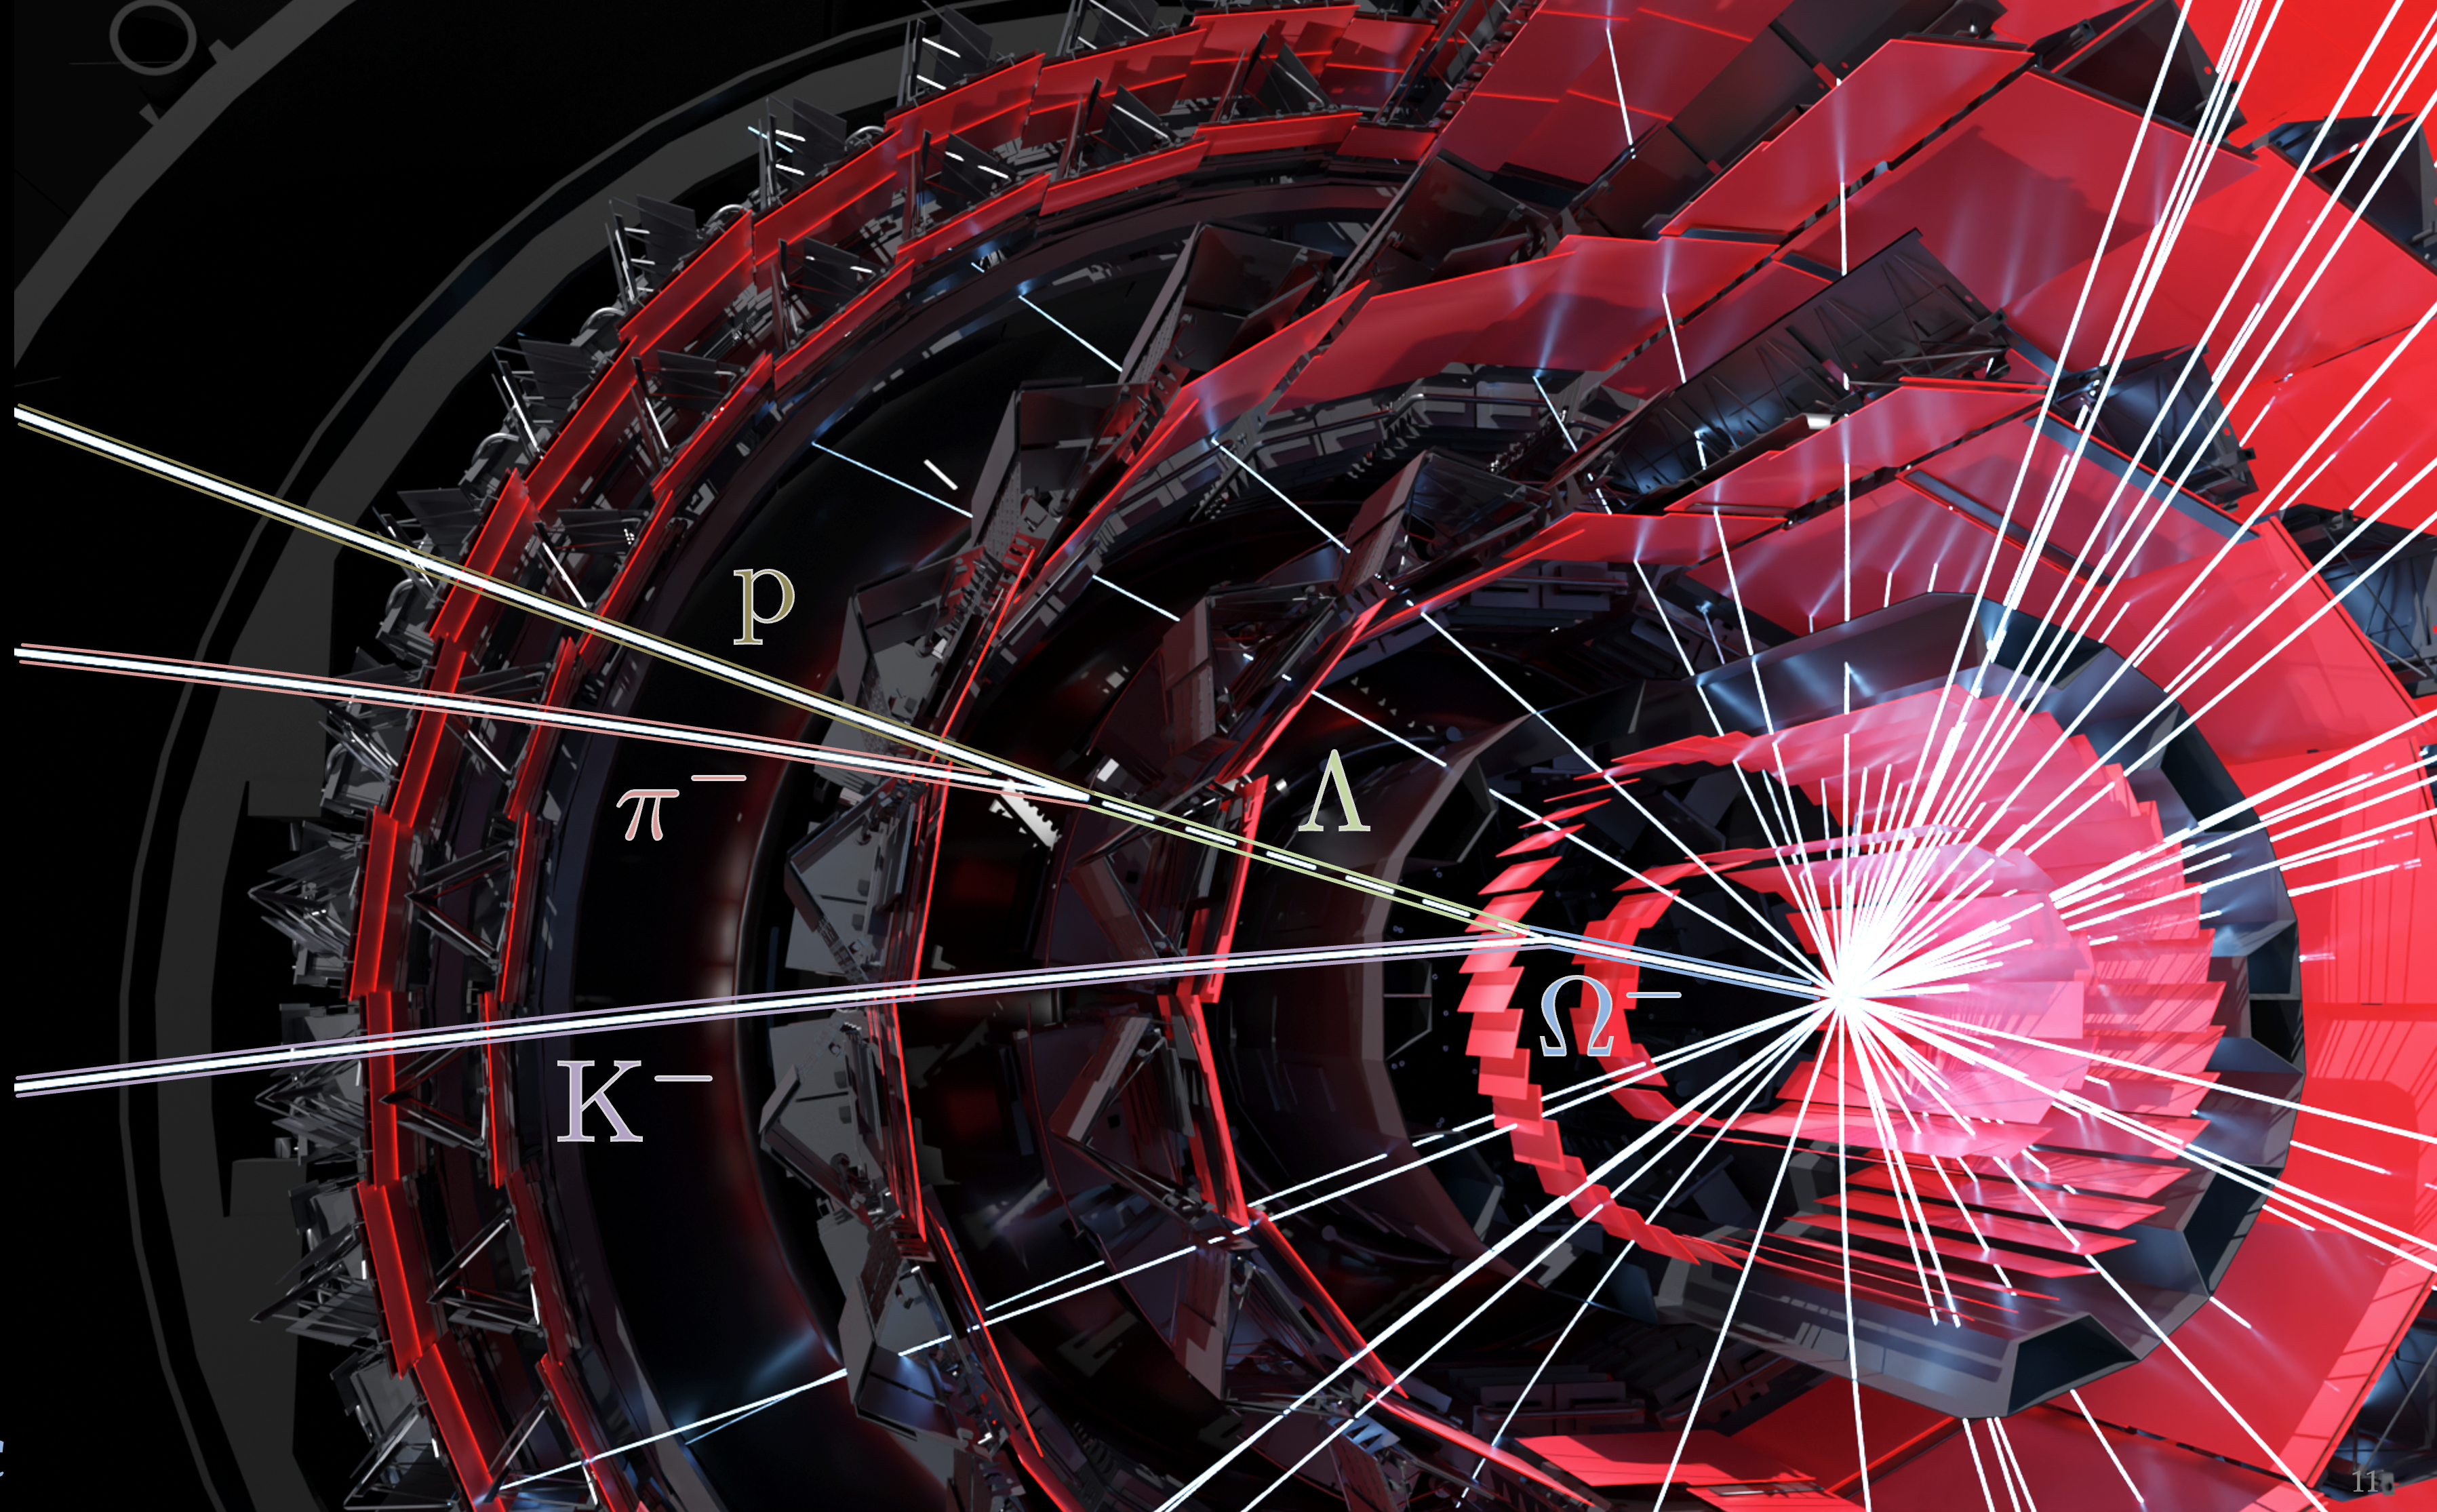 |
Figure 2
Examples of invariant-mass distributions of the $\Xi^{-}$ (\ref{fig:XiMinus_TripleGaussian}), $\overline{\Xi}^{+}$ (\ref{fig:XiPlus_TripleGaussian}), $\Omega^{-}$ (\ref{fig:OmegaMinus_TripleGaussian}) and $\overline{\Omega}^{+}$ (\ref{fig:OmegaPlus_TripleGaussian}). The measured mass $\mu$ and mass resolution $\sigma$ from the fit, with their associated statistical uncertainties, are displayed. | 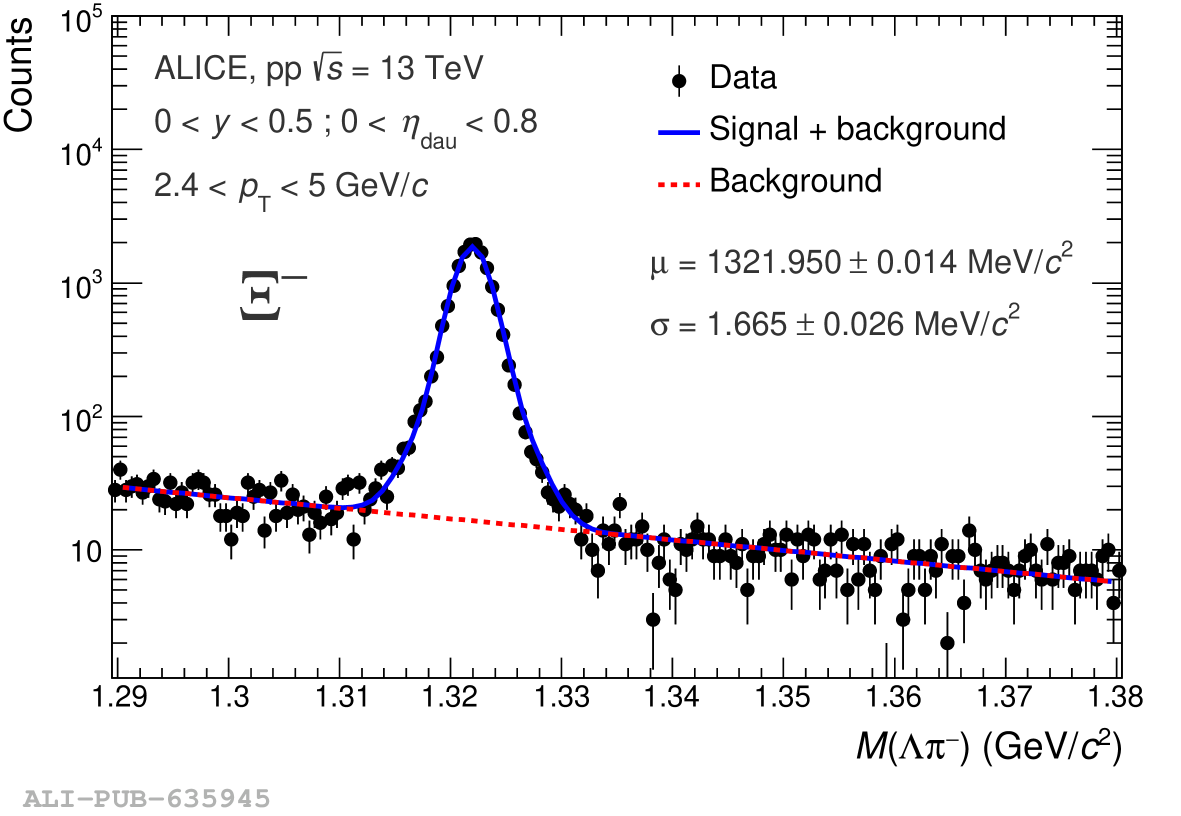 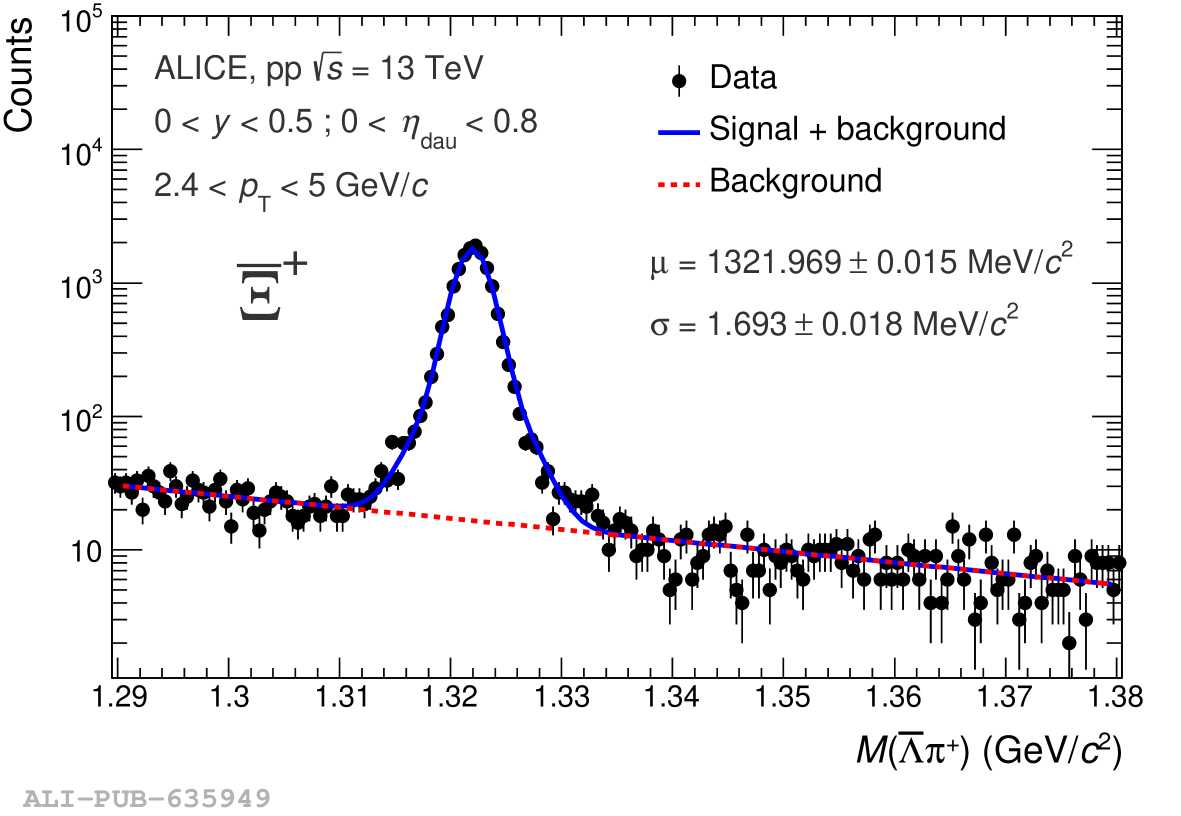 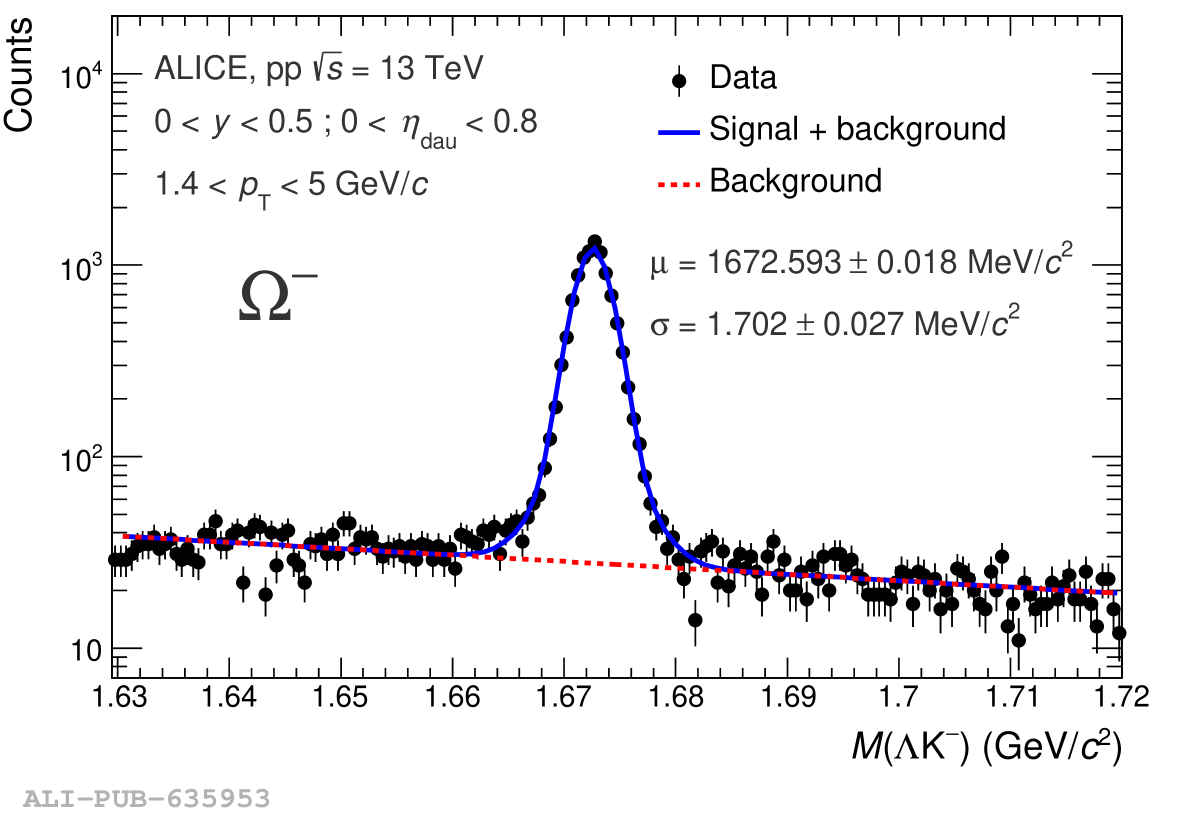 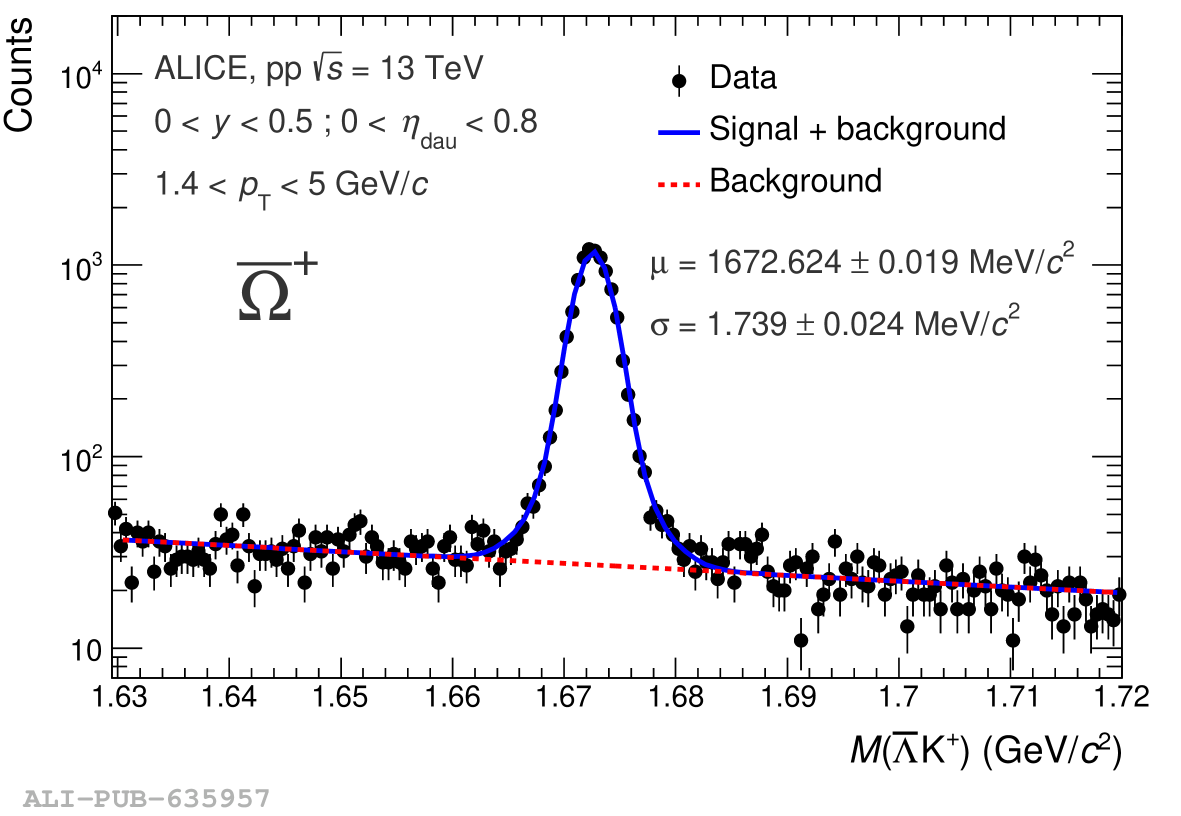 |
Figure 3
Measurements of the mass of $\Xi^{-}$, $\overline{\Xi}^{+}$, $\Omega^{-}$, $\overline{\Omega}^{+}$. The present results are shown in red. The vertical lines and bands represent the mass values currently tabulated by the PDG ; The full blue markers represent the measurements on which such PDG average values rely, by contrast to the open grey markers standing for measurements that were discarded Note that for the present averages, the PDG assumes \emph{a priori} a strict equality of mass between particle and antiparticle, it implies that the average PDG mass for $\Xi$ stems indifferently from $\Xi^{-}$ and $\overline{\Xi}^{+}$ input. The same situation is met for the PDG $\Omega$ mass with $\Omega^{-}$ and $\overline{\Omega}^{+}$ input (See Ref. and reference therein for accessing the individual measurements.)The horizontal lines correspond to the total uncertainties, obtained by summing the statistical and systematic uncertainties in quadrature. | 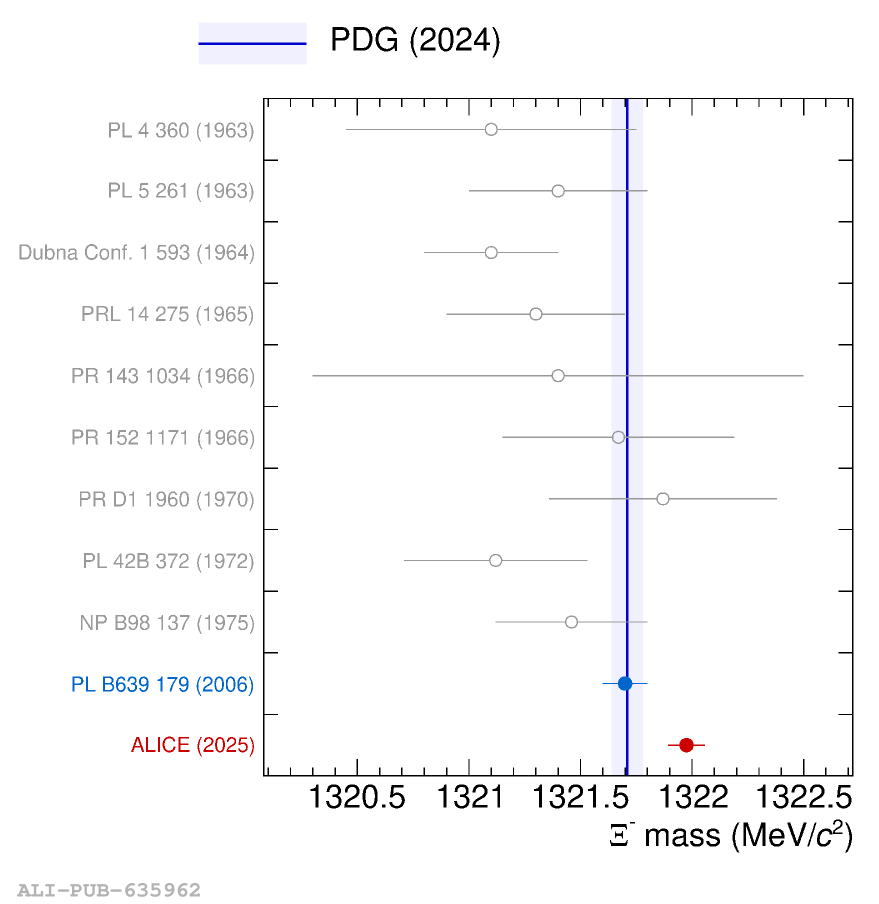 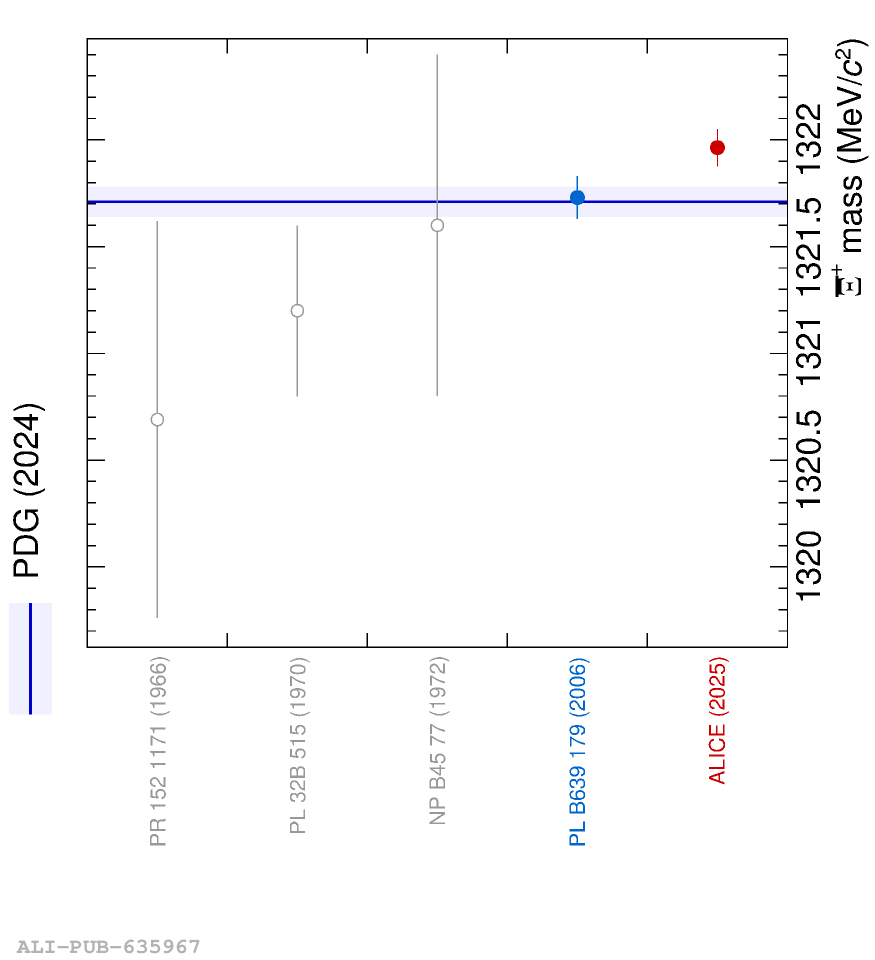 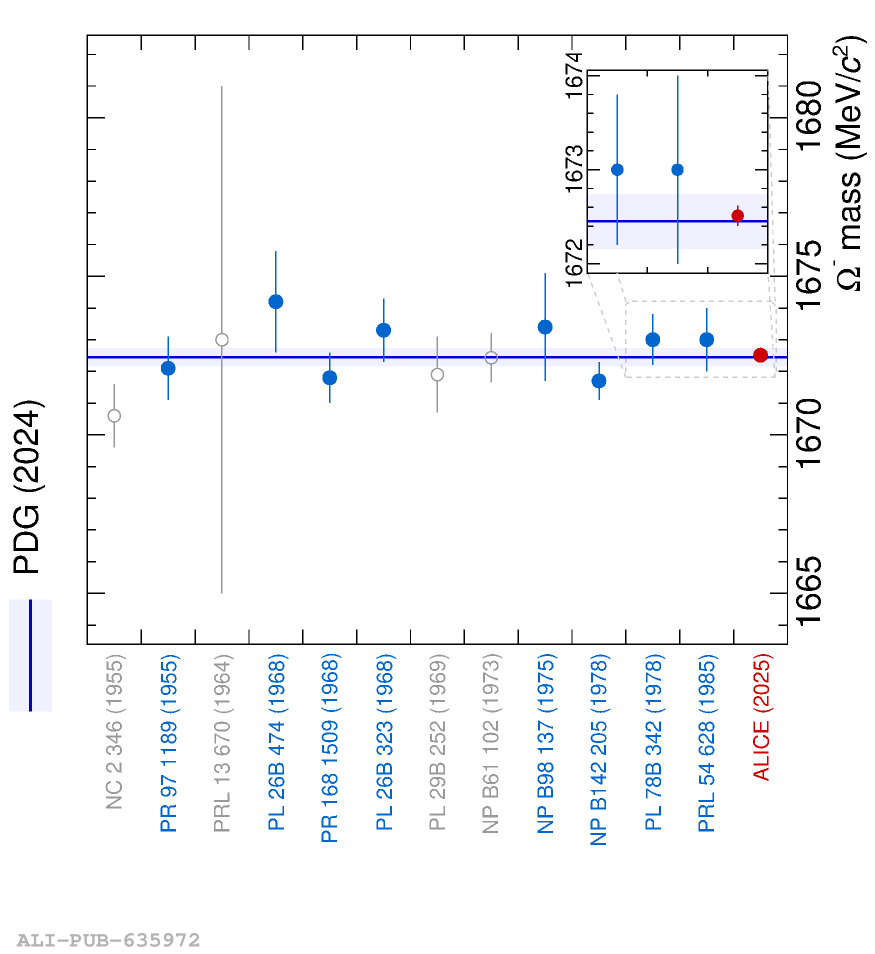 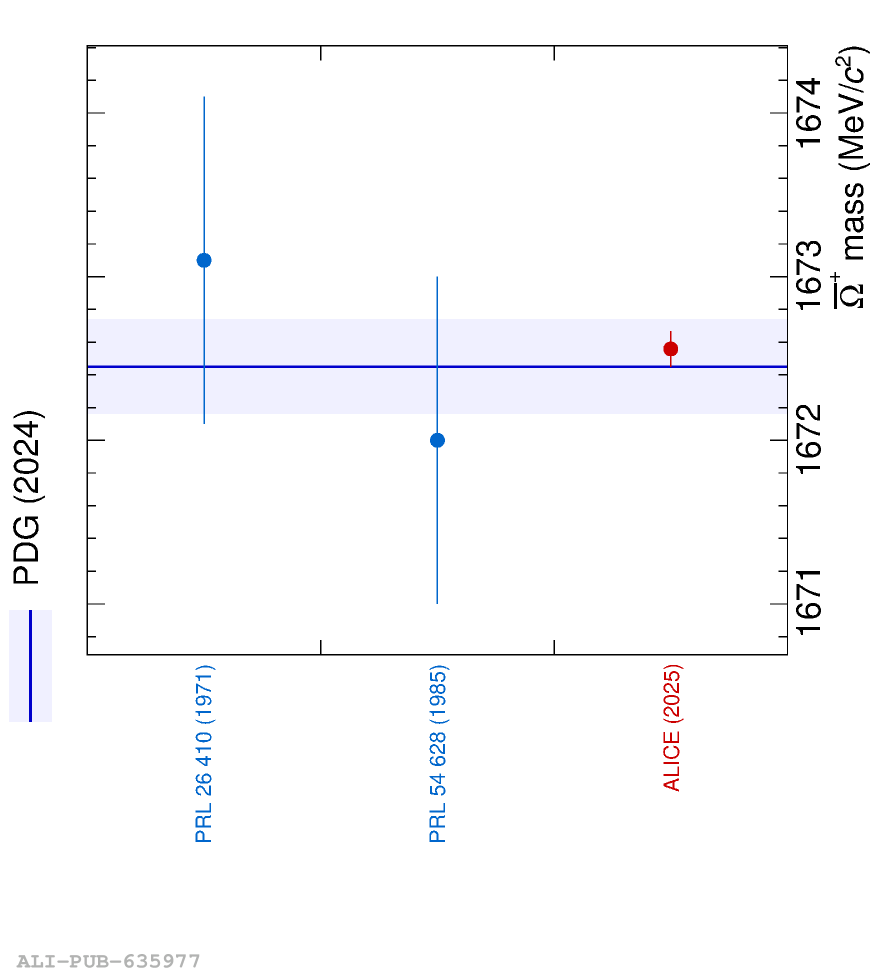 |
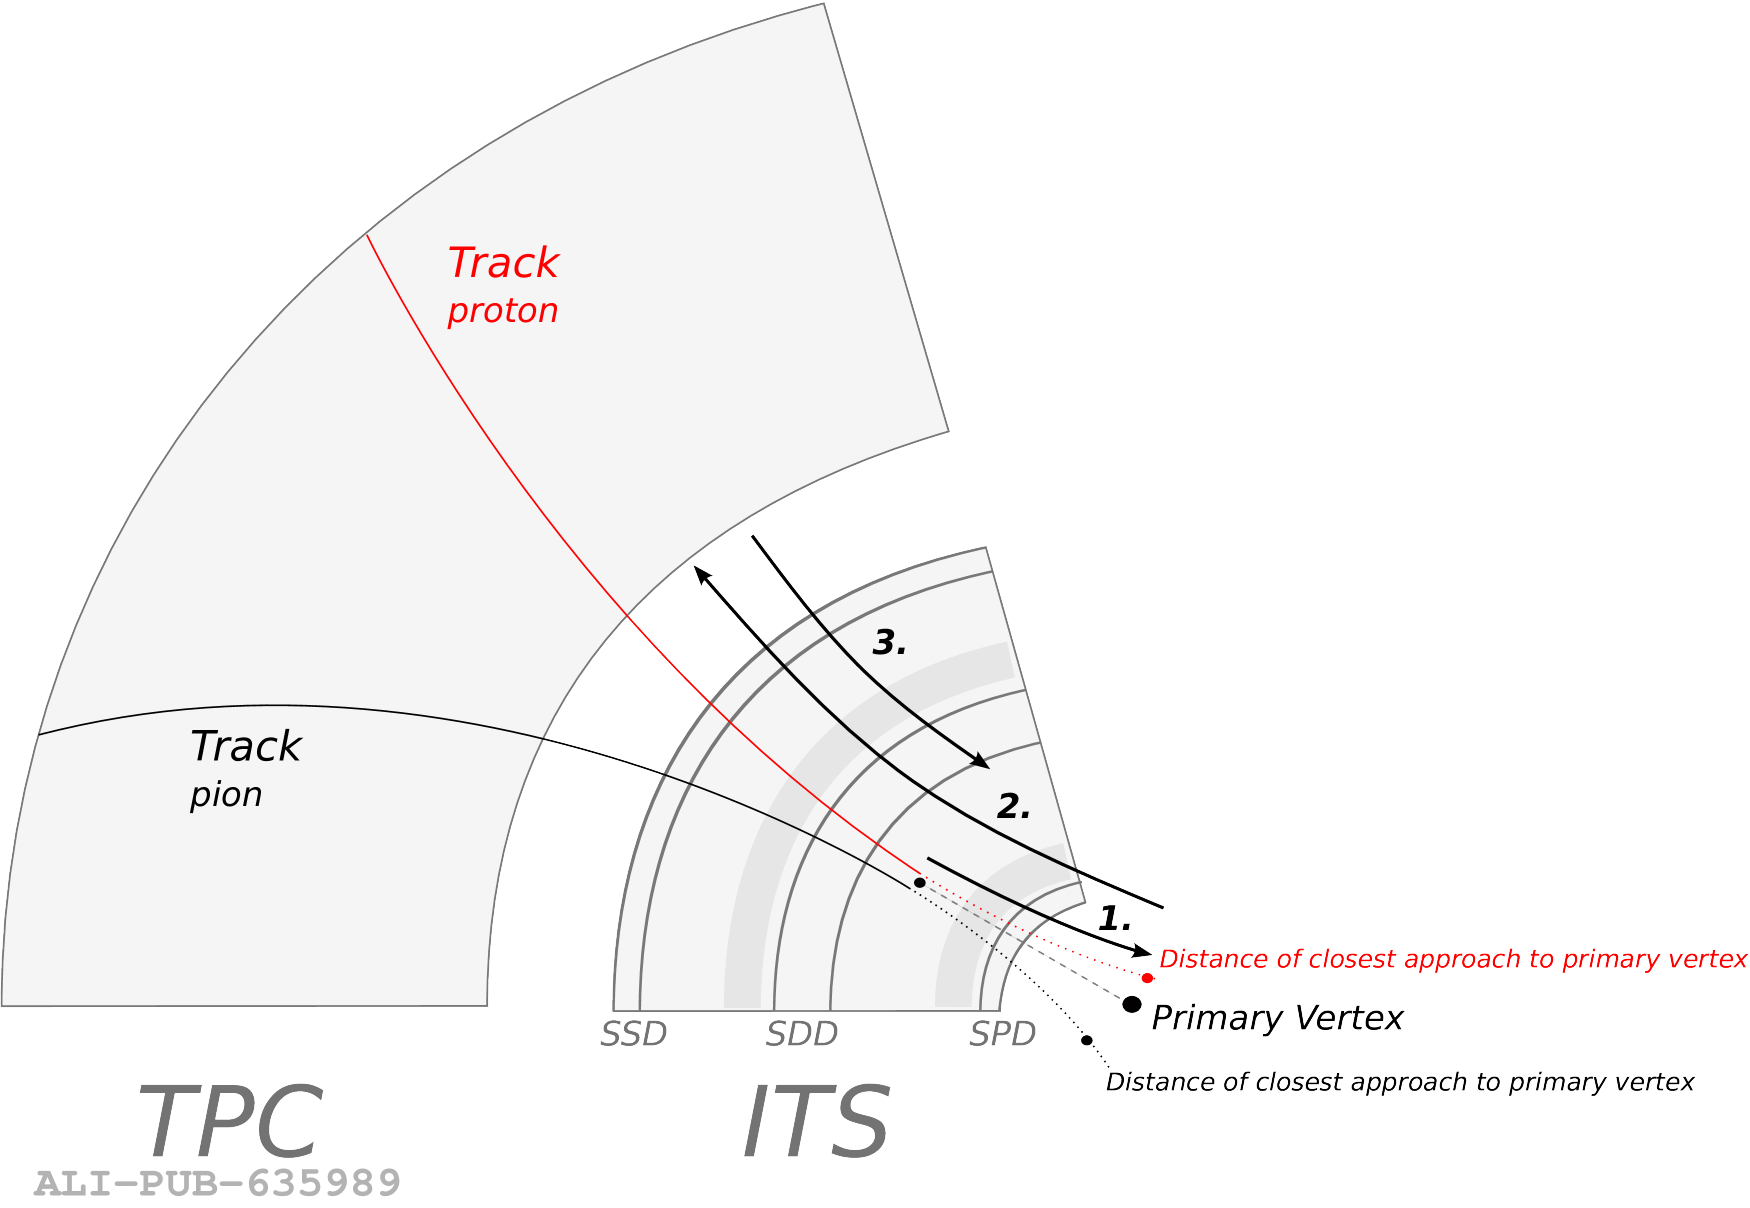
Figure A.4
Measurements of the mass of \pkazero, $\plam$, $\Xis$ and $\Oms$ with respect to the average value as a function of the data-taking period. Horizontal bands represent the total uncertainties obtained from the combined analysis of all data-taking periods for particles (solid lines) and antiparticles (dashed lines). | 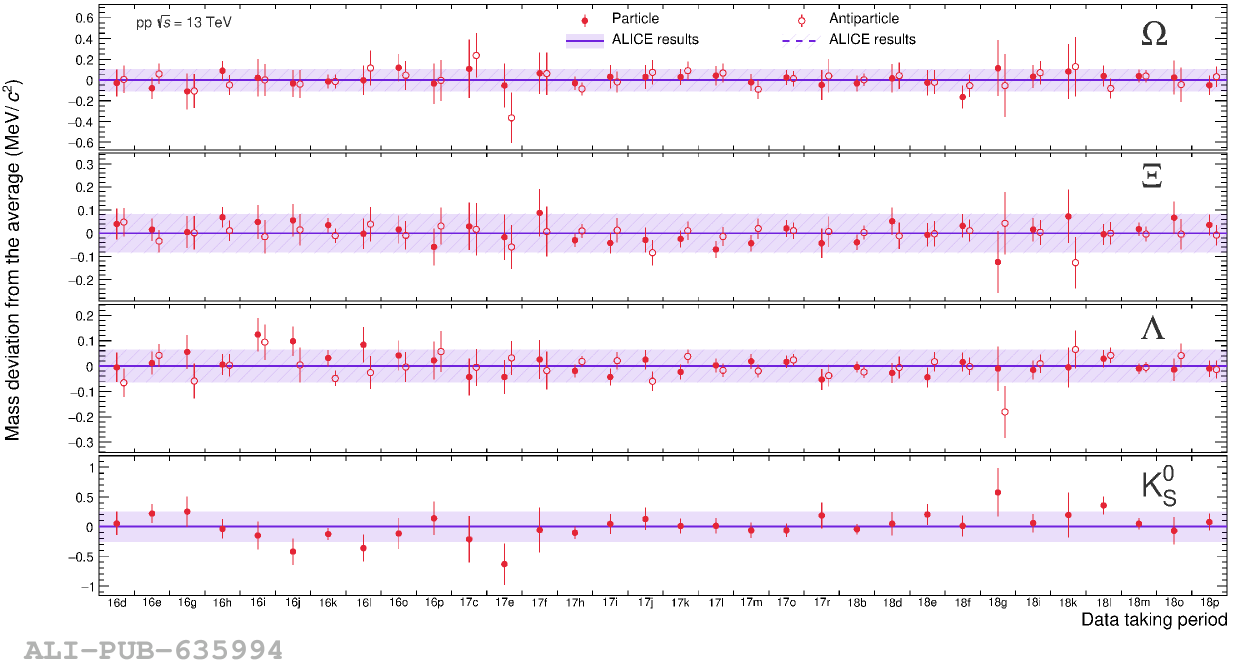 |