The interaction between nucleons and hyperons - baryons containing a strange quark - is key to understanding the properties of dense nuclear matter, such as that expected in the interior of neutron stars. Direct scattering experiments are hindered by the short lifetime of hyperons, prompting the study of hypernuclei - bound states of nucleons and hyperons - as an alternative approach. The lightest known hypernucleus, the hypertriton ($^3_Λ$H), is a weakly bound state composed of a proton, a neutron and a $Λ$ hyperon, and is believed to exhibit a halo-like structure with the $Λ$ being loosely bound to a deuteron core. Based on the first measurement of hypertriton production in proton-proton collisions at the CERN Large Hadron Collider (LHC), its halo structure is confirmed. A successful description of the hypertriton production yield within the nuclear coalescence framework enables an estimation of the $Λ$ separation from the deuteron core as $9.54^{+2.67}_{-1.11}$ fm.
Submitted to: OTHERS
e-Print: arXiv:2604.07949 | PDF | inSPIRE
CERN-EP-2026-097
Figure group
Figure 1
The $^{3}_{\Lambda}{\rm H}/\Lambda$ ratio as a function of the mean charged-particle multiplicity ($\langle {\rm d}N_{\rm ch}/{\rm d}\eta\rangle_{|\eta|< 0.5}$) measured at $\sqrt{s} = 13$ TeV for two multiplicity classes (full red circles), together with a previous experimental result in p--Pb collisions (black cross). Furthermore the CSM thermal model prediction is displayed as black line and the blue and green bands represent the predictions of the two-body and three-body coalescence, respectively. The vertical lines represent the statistical uncertainties, while the vertical boxes are the systematic ones. | 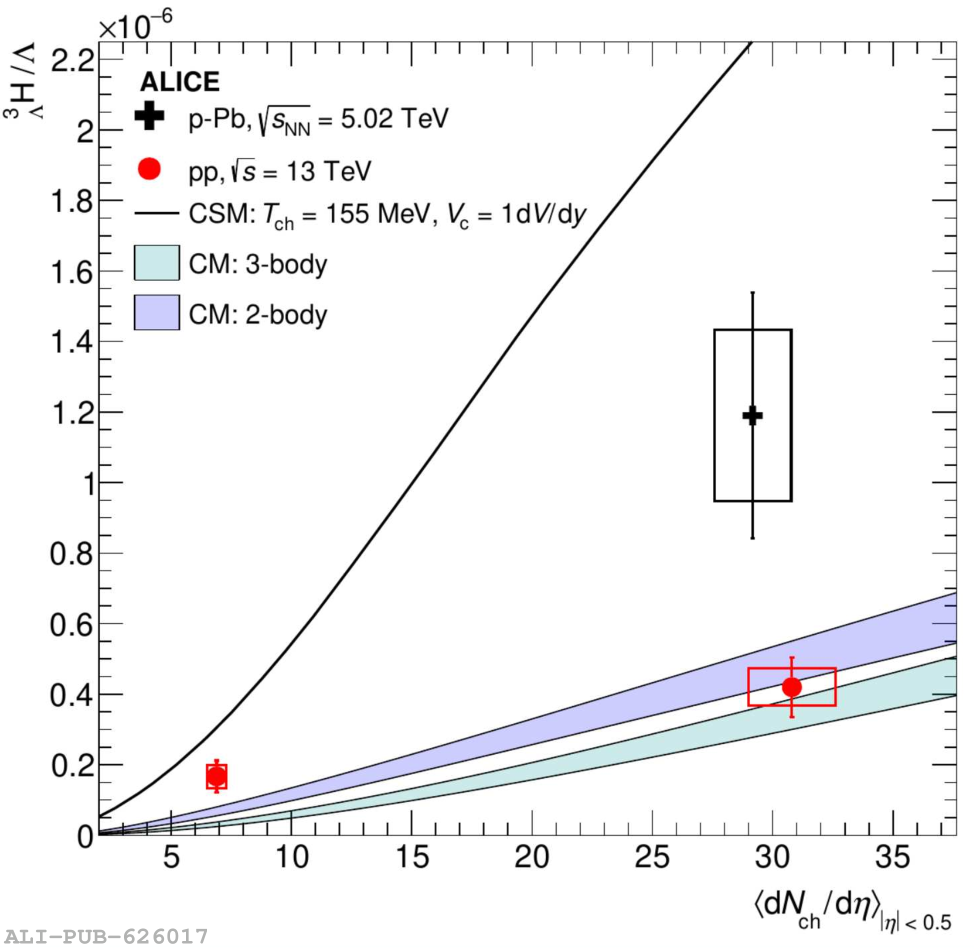 |
Figure 2
Object sizes of deuteron (green), $^{3}{\rm He}$ (blue) and $^{3}_{\Lambda}{\rm H}$ (red) obtained from experimental d/p, $^{3}{\rm He}$/p and $^{3}_{\Lambda}{\rm H}/\Lambda$ ratios using the corresponding coalescence formulae. The vertical bars represent the statistical uncertainty resulting from the measured yield ratio. The shaded boxes show the systematic uncertainties (e.g due to the uncertainties on the source size). The combined object size for each species is indicated by the dashed lines and the bands represents the corresponding uncertainties. | 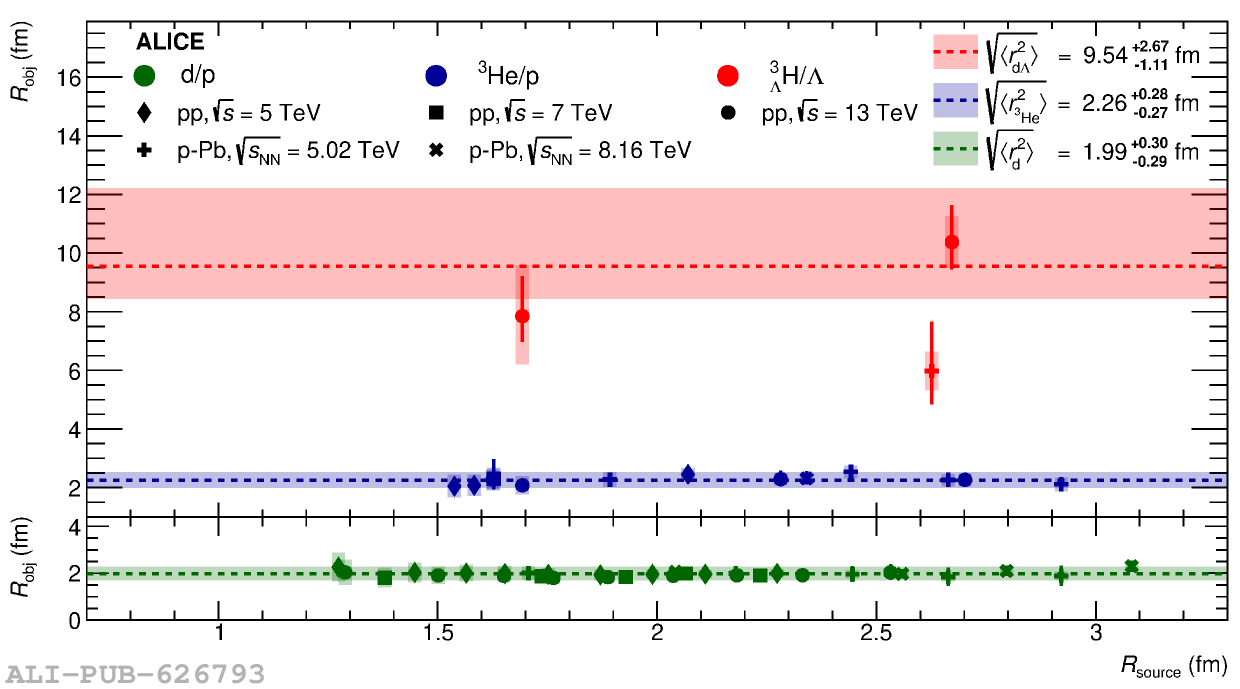 |
Figure 3
Hypertriton radius calculated from the $\Lambda$ separation energy using the pionless EFT (blue band) and a simple quantum mechanical model (dashed black line). The measured hypertriton radius is shown as a red band. The red point represents $B_\Lambda$, which is determined from the intersection of the central values of the EFT calculation and the measured radius. The red contour is the total uncertainty of the measurement. The vertical lines represent the obtained value of $B_\Lambda$ (middle full line) and its uncertainty (outer dashed lines). In the lower panel the $B_\Lambda$ world average is shown. | 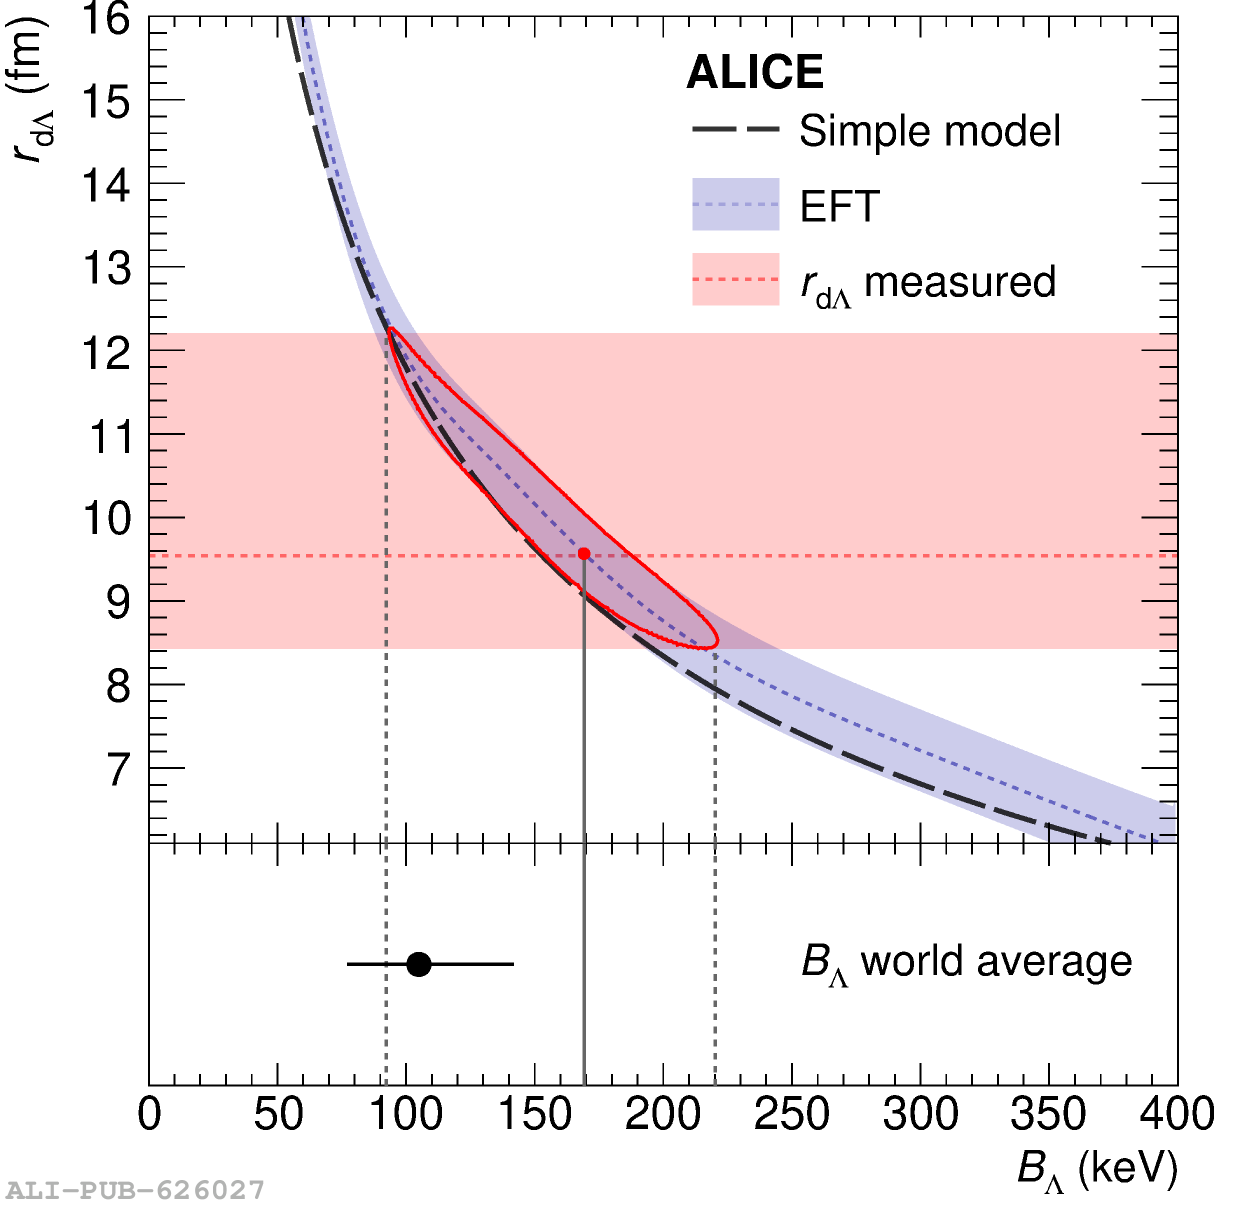 |
Figure A.1
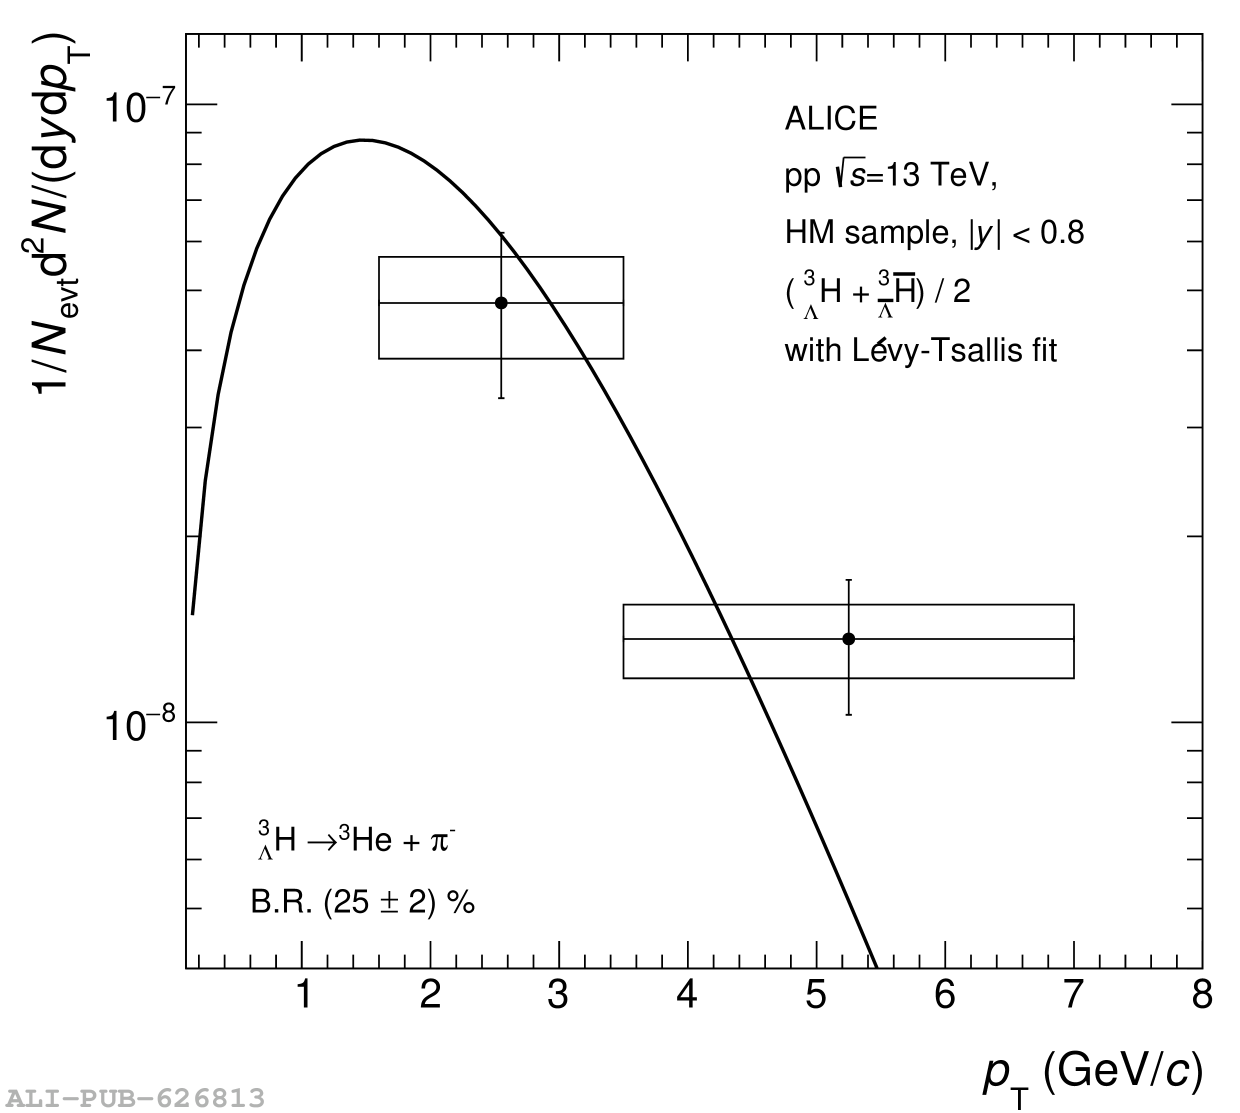
Invariant-mass spectra of $^{3}_{\Lambda}{\rm H}$ + $^{3}_{\Lambda}{\bar {\rm H}}$) integrated over $p_{\rm T}$, for the HM data sample (left) and the MB sample (right). The fitted functions used to extract the raw yields are shown as blue curves, while the background components are shown as orange dashed curves. | 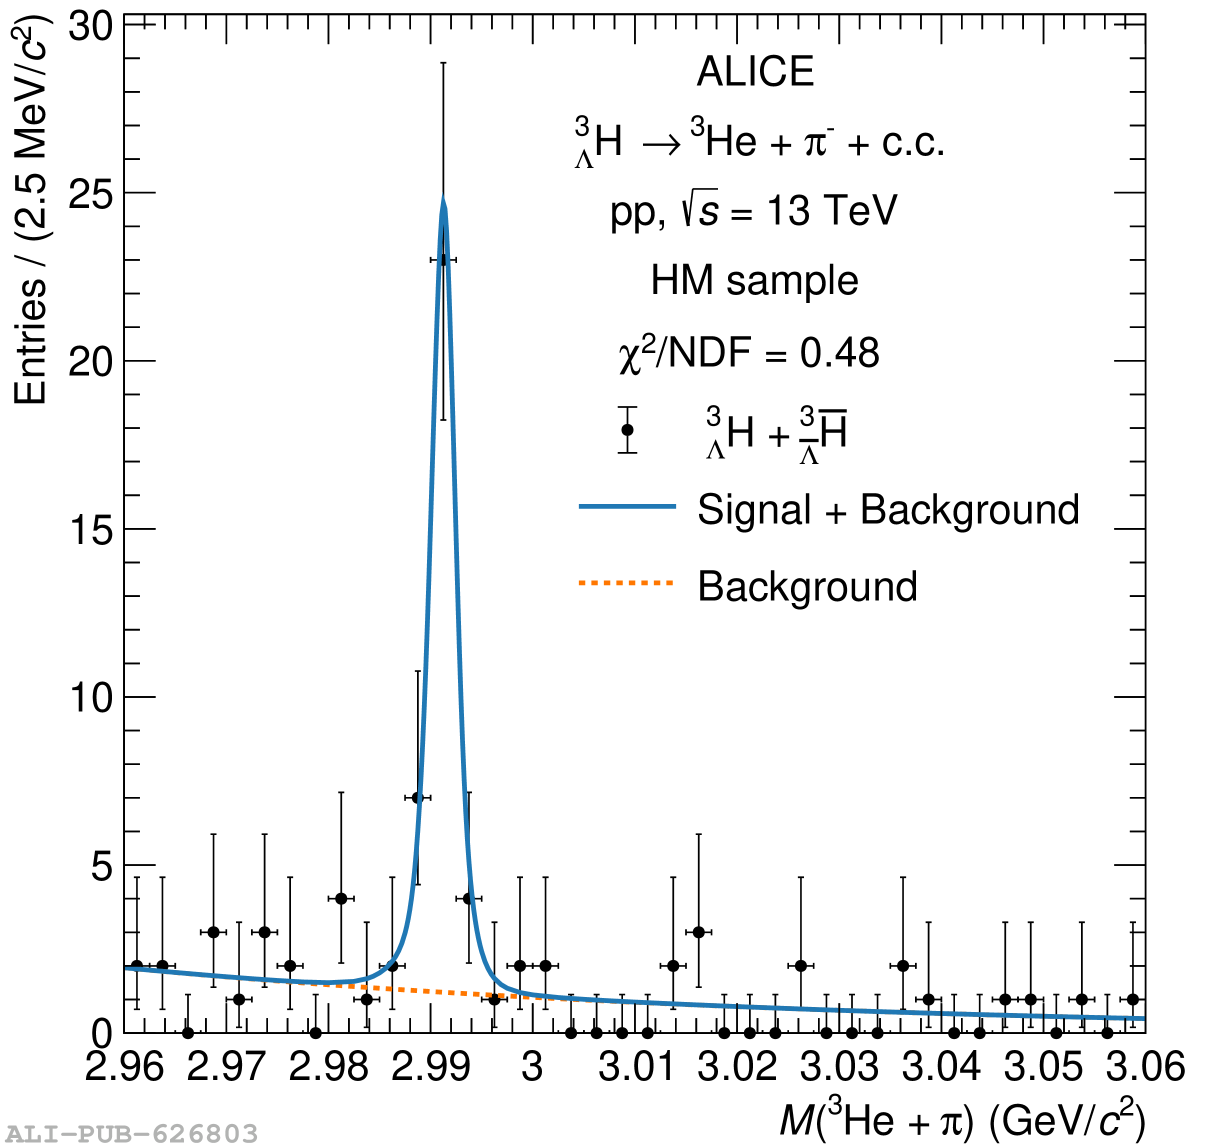 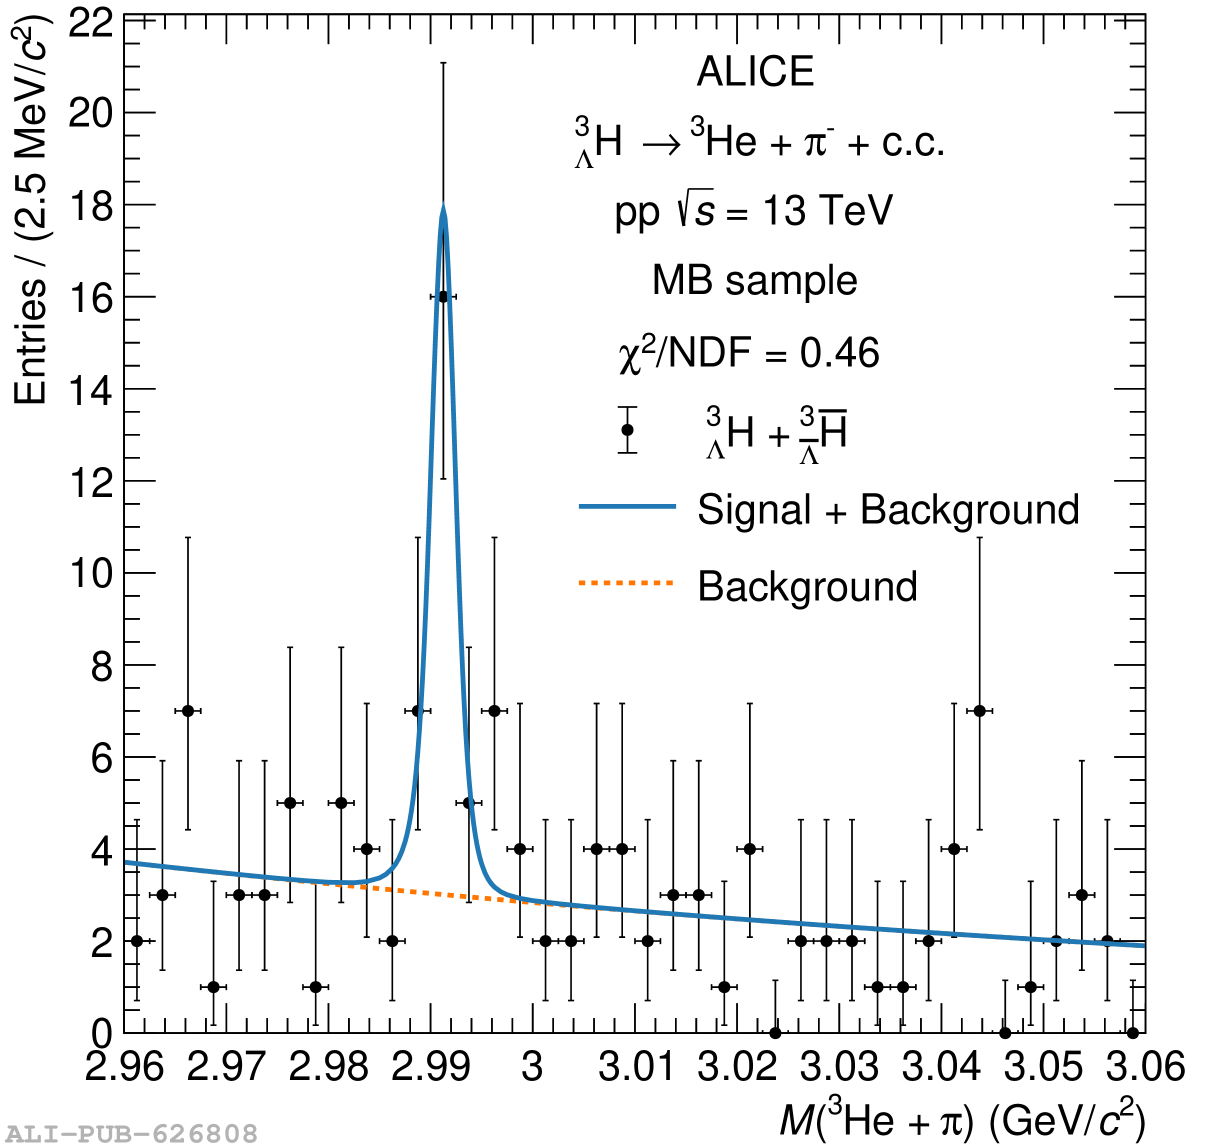 |