This article reports the measurement of the transverse-momentum ($p_{\rm T}$) differential production cross section of B$^0$ mesons in proton-proton collisions at a centre-of-mass energy of $\sqrt{s}=13.6$ TeV with the ALICE detector at the CERN LHC. For the first time, the B$^0$ production cross section is measured at midrapidity ($|y|<~0.5$) down to $p_{\rm T}=1~\mathrm{GeV}/c$ at LHC energies. The B$^0$ mesons and their charge conjugates were reconstructed via the B$^{0}\to$D$^{-}π^+$ decay channel, followed by the D$^-\to$K$^+π^-π^-$ decay. The measured $p_{\rm T}$-differential production cross section is described within uncertainties by state-of-the-art models based on perturbative quantum-chromodynamics calculations. Its rapidity dependence is also studied by computing the $p_{\rm T}$-differential ratios between the ALICE measurement and the one of B$^+$ mesons performed by the LHCb Collaboration at forward rapidity. The B$^0$ production cross section per unit of rapidity at midrapidity is ${\rm d}σ({\rm B^0})/{\rm d} y|_{|y|<~0.5} = 24.2 \pm 1.4~(\text{stat.}) \pm 2.6~(\text{syst.})_{-0.3}^{+0.2}~(\text{extrap.})~μ{\rm b}$.
Submitted to: JHEP
e-Print: arXiv:2603.18904 | PDF | inSPIRE
CERN-EP-2026-077
Figure group
Figure 2
Invariant-mass distributions of $\mathrm{B^0}$-meson candidates in the $1 < \pt < 23.5$ $\mathrm{GeV}/c$ (top), $2 < \pt < 4$ $\mathrm{GeV}/c$ (bottom-left), and $10 < \pt < 14$ $\mathrm{GeV}/c$ (bottom-right) intervals. The contributions of the different partially and mis-reconstructed decays to the total fit function (blue) are reported on top of the combinatorial background fit function (red dashed line) with filled colour-coded areas. The values of the signal counts ($S$) are reported in the text. | 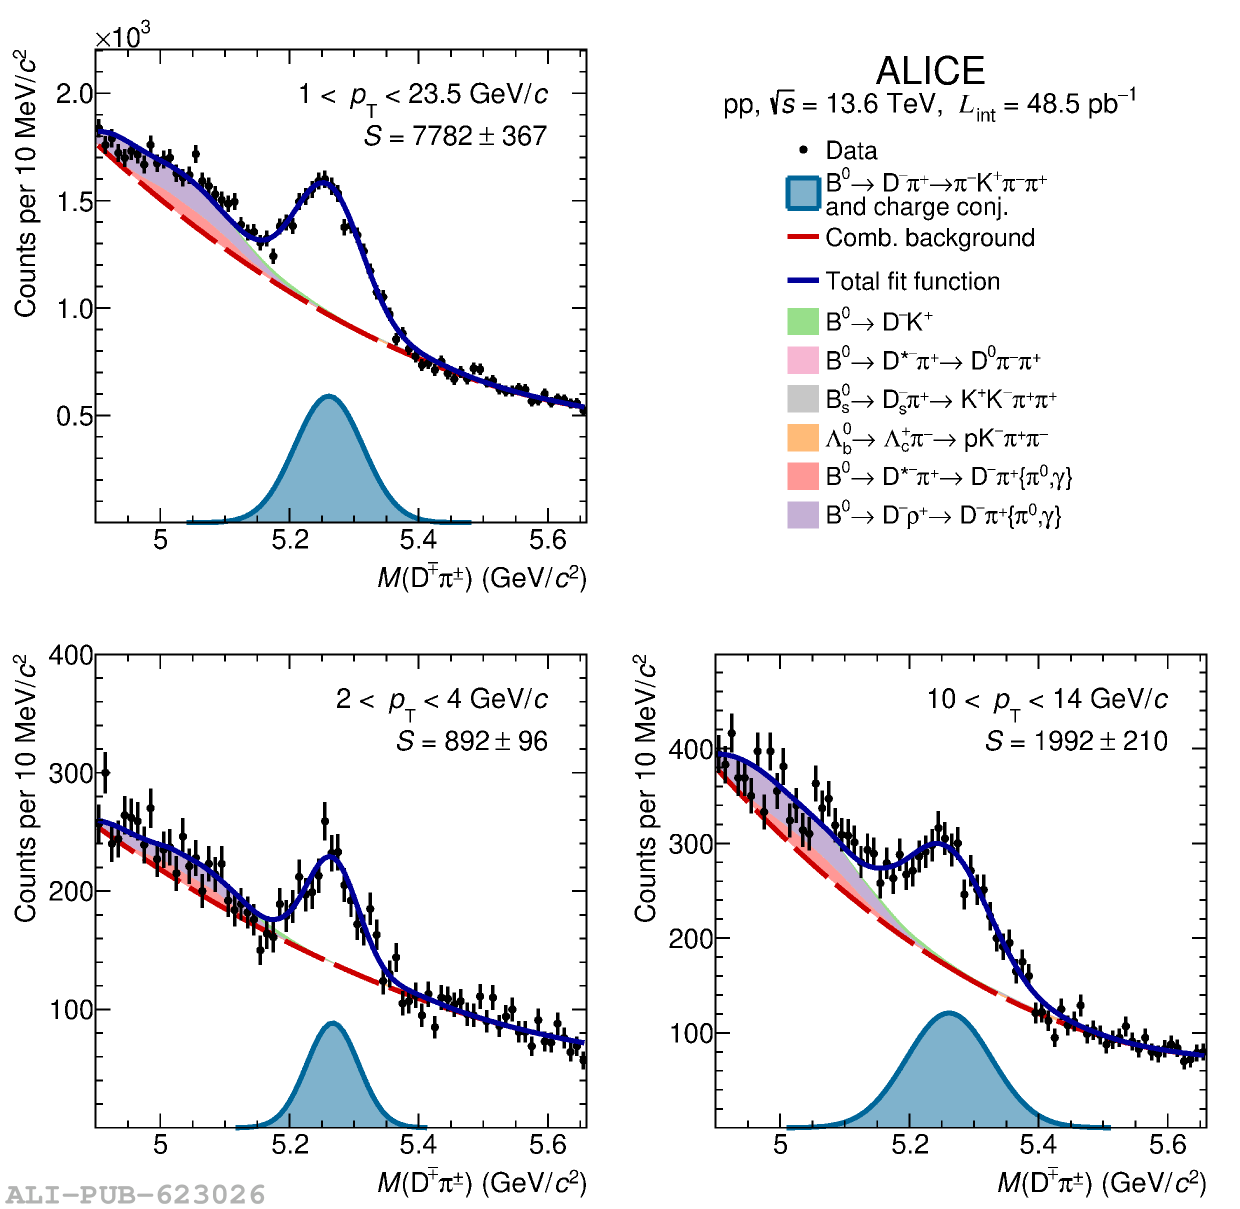 |

Figure 4
$\pt$-differential production cross section of $\mathrm{B^0}$ mesons measured at midrapidity ($|y| < 0.5$) in pp collisions at $\sqrt{s}=13.6$ $\mathrm{TeV}$ compared with FONLL, GM-VFNS(mod-$\mu_{R,F}$), GM-VFNS(SACOT-$m_\mathrm{T}$), and $k_\mathrm{T}$-factorisation calculations (left panel) and ratios of the data to the theoretical predictions (right panel). Statistical uncertainties are depicted as vertical error bars, and systematic uncertainties as boxes. The systematic uncertainties related to normalisation are quoted separately as text. |  |
Figure 5
$\pt$-differential production cross section of $\mathrm{B^0}$ mesons measured at midrapidity ($|y|< 0.5$) in pp collisions at $\sqrt{s}=13.6$ $\mathrm{TeV}$ compared with $k_\mathrm{T}$-factorisation calculations. The contributions to the predicted $\mathrm{B^0}$ production cross section arising from gluon and beauty-quark fragmentation into a $\mathrm{B^0}$ meson are also shown. Statistical uncertainties are depicted as vertical error bars, and systematic uncertainties as boxes. The systematic uncertainties related to normalisation are quoted separately as text. |  |
Figure 6
$\pt$-differential production cross section of $\mathrm{B^0}$ mesons measured at midrapidity ($|y|< 0.5$) in pp collisions at $\sqrt{s}=13.6$ $\mathrm{TeV}$ compared with FONLL and NNLO+NNLL calculations (left panel) and ratios of the data to the theoretical predictions (right panel). Statistical uncertainties are depicted as vertical error bars, and systematic uncertainties as boxes. The systematic uncertainties related to normalisation are quoted separately as text. |  |
Figure 7
$\pt$-differential production cross section of $\mathrm{B^0}$ mesons measured at midrapidity ($|y|< 0.5$) in pp collisions at $\sqrt{s}=13.6 \mathrm{TeV}$ compared with Catania, TAMU, EPOS4HQ, and AMPT models (left panel) and ratios of the data to the theoretical predictions, where the latter are integrated over the width of the experimental $\pt$ intervals. (right panel). Statistical uncertainties are depicted as vertical error bars, and systematic uncertainties as boxes. The systematic uncertainties related to normalisation are quoted separately as text. | 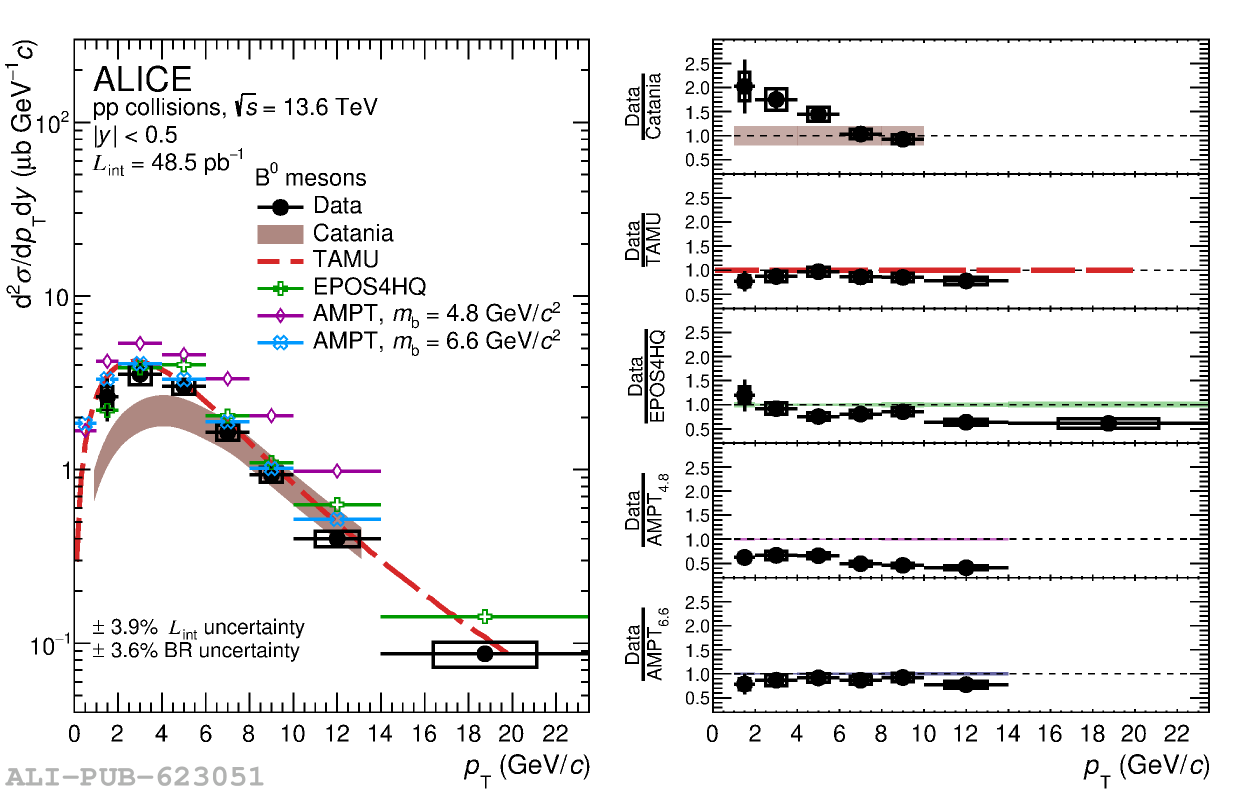 |
Figure 8
Ratios of $\pt$-differential production cross sections per unit of rapidity of $\mathrm{B^0}$ mesons at midrapidity ($|y|< 0.5$) in pp collisions at $\sqrt{s}=13.6$ $\mathrm{TeV}$ to those measured by the LHCb Collaboration for $\mathrm{B^+}$ mesons in pp collisions at $\sqrt{s}=13$ $\mathrm{TeV}$ in three intervals of rapidity, $2< y< 2.5$ (left panel), $3< y< 3.5$ (middle panel), and $4< y< 4.5$ (right panel). Statistical uncertainties are reported as vertical error bars, and systematic uncertainties as boxes, except for BR uncertainties that are quoted separately as text. The data points are compared to pQCD calculations (FONLL, NNLO+NNLL) in the upper row, phenomenological models (EPOS4HQ and AMPT) in the middle row, and to the same ratio measured for $\mathrm{D^0}$ mesons in pp collisions at $\sqrt{s}=13$ $\mathrm{TeV}$ in the bottom row. | 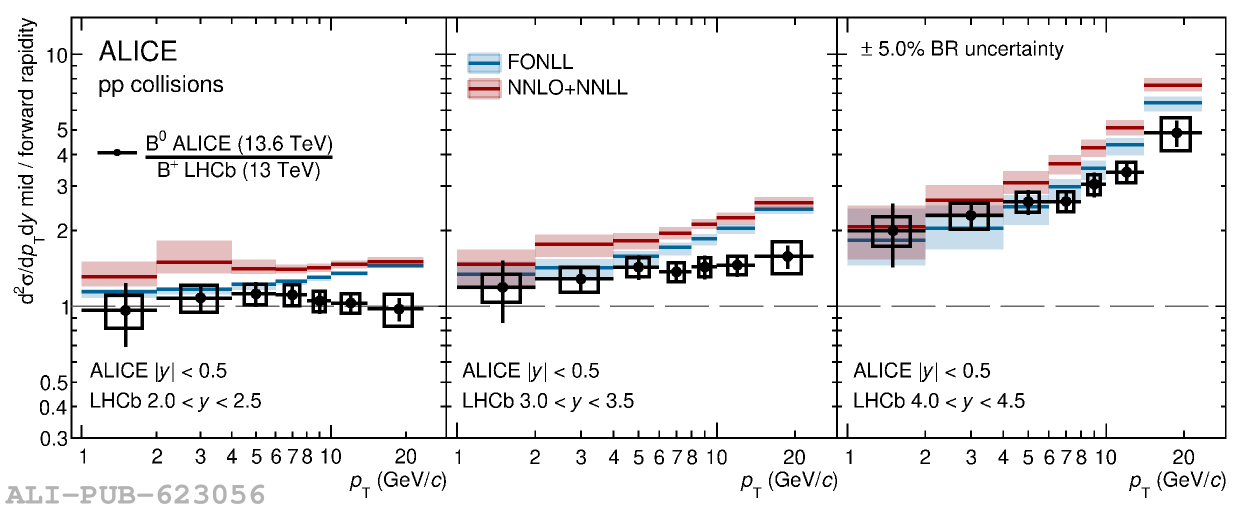 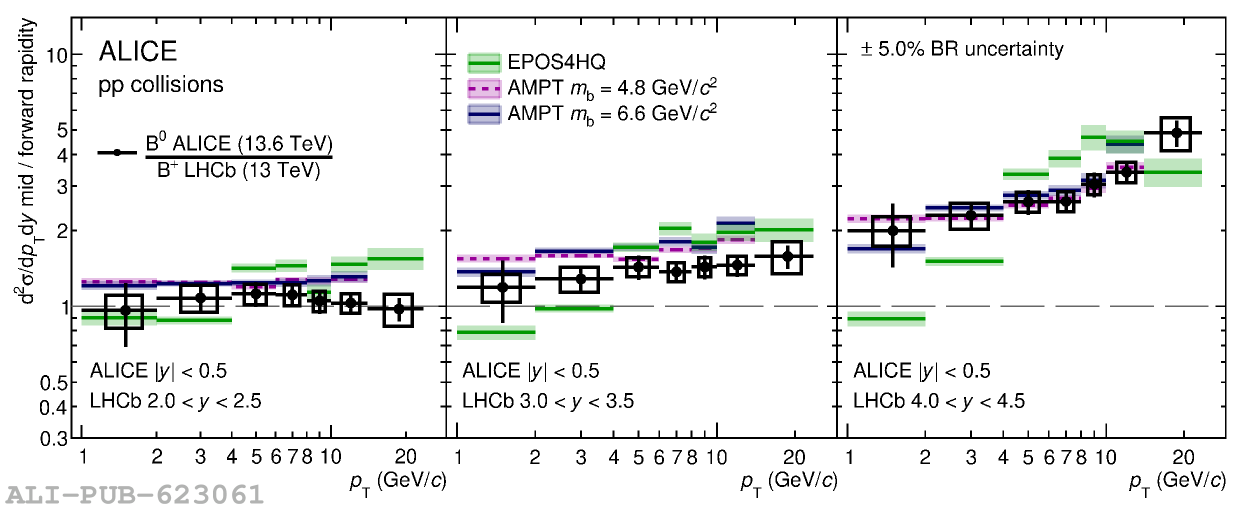 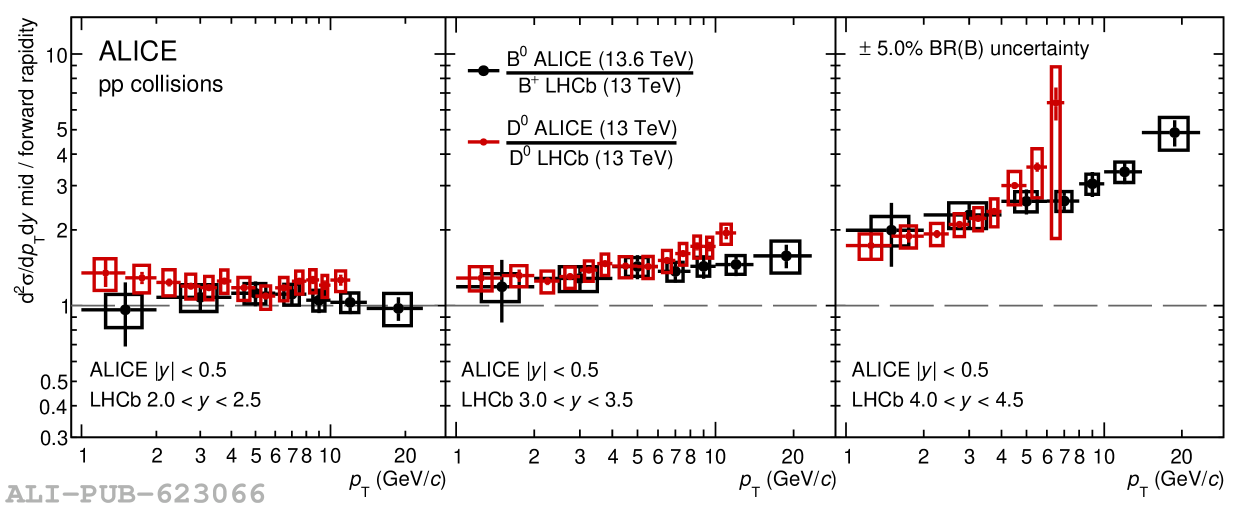 |
Figure A.1
$\pt$-differential production cross section of $\mathrm{B^0}$ mesons at midrapidity ($|y|< 0.5$) at the centre-of-mass energy of $\sqrt{s}=13.6$ $\mathrm{TeV}$ compared with measurements of the production cross section of $\mathrm{B^+}$ mesons performed at $\sqrt{s}=13$ $\mathrm{TeV}$ by the CMS Collaboration at midrapidity and by the LHCb Collaboration at forward rapidities. The FONLL calculations for the corresponding $\pt$ and rapidity intervals are also shown as filled boxes. | 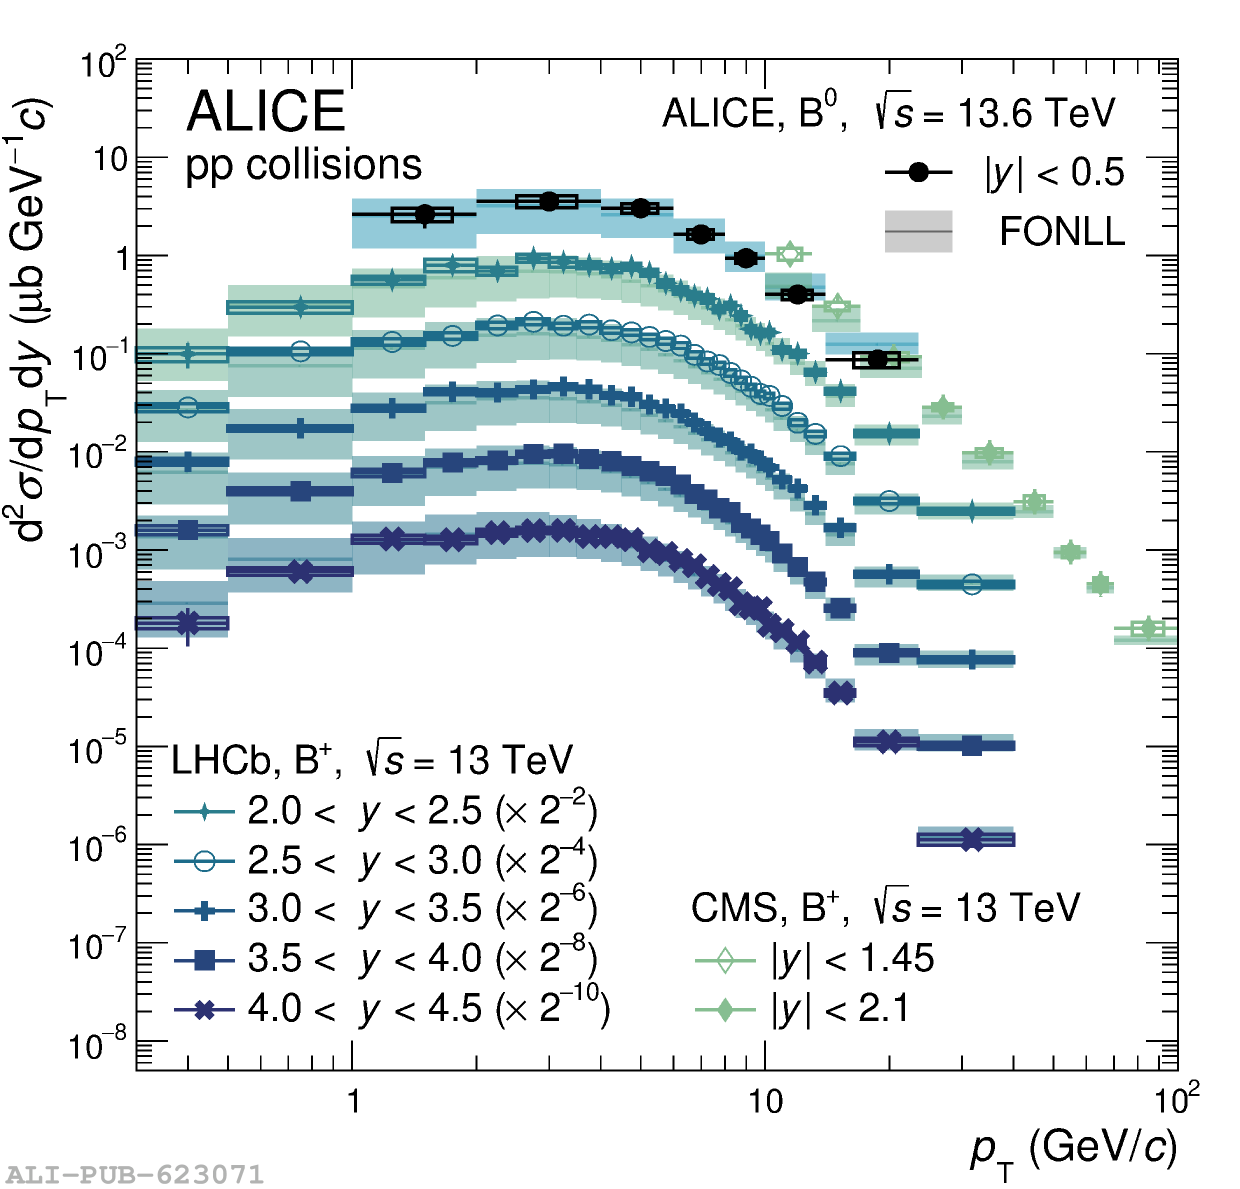 |