The measurement of the transverse-momentum fraction ($z^{\rm ch}$) carried by prompt and non-prompt J/$ψ$ in charged-particle jets in proton--proton collisions with a center-of-mass energy $\sqrt{s}= 13$ TeV is reported by the ALICE Collaboration at the CERN Large Hadron Collider. The measurement is based on a Transition Radiation Detector triggered data sample corresponding to an integrated luminosity of $\mathcal{L} = 1.63\pm0.03$ pb$^{-1}$. Inclusive J/$ψ$ mesons with transverse momentum ($p_{\rm T}$) above 1 GeV/$c$ are reconstructed at midrapidity through the electron--positron decay channel. The prompt and non-prompt J/$ψ$ contributions are separated using the secondary vertices from beauty-hadron decays. Jets are reconstructed from J/$ψ$-meson candidates and charged particles using the anti-$k_{\rm T}$ algorithm with jet resolution parameter $R = 0.4$ in the pseudorapidity range $|η_{\text{jet}}| <~ 0.5$. The distribution of the charged-particle jet $p_{\rm T}$ fraction carried by the prompt and non-prompt J/$ψ$ mesons, $z^{\rm ch}$, is measured in the range $0.3 <~ z^{\rm ch} \leq 1.0$ for the jet-$ p_{\rm T}$ range $7 <~ p_{\rm T}^{\rm jet} <~ 15$ GeV/$c$. The measured $z^{\rm ch}$ distributions for prompt and non-prompt J/$ψ$ are compared to pQCD calculations and PYTHIA 8 simulations. Prompt and non-prompt J/$ψ$ production within charged-particle jets are found to be qualitatively well reproduced by PYTHIA 8 for $z^{\rm ch}<~0.9$, however, as $z^{\rm ch}$ approaches one, the simulations overshoot the measured data, indicating an overestimation of the fraction of isolated J/$ψ$. This observed tension between data and simulations in the highest $z^{\rm ch}$ bins reflects the challenge of simulating hadronization of low-momentum jets.
Submitted to: JHEP
e-Print: arXiv:2602.22889 | PDF | inSPIRE
CERN-EP-2026-019
Figure group
Figure 1
Invariant-mass (left) and pseudo-proper decay-length (right) distributions for \jpsi candidates, measured in charged-particle jets with $7\ptjetch15$ \GeVc, with superimposed projections of the maximum-likelihood fit for the intervals $0.4 \z 0.5$ and $0.90 \z 0.95$ in the top and bottom panels, respectively. The pseudo-proper decay-length distributions are shown for \jpsi candidates reconstructed in the invariant-mass range $2.92 \mee 3.16$ \GeVmass for display purposes only. | 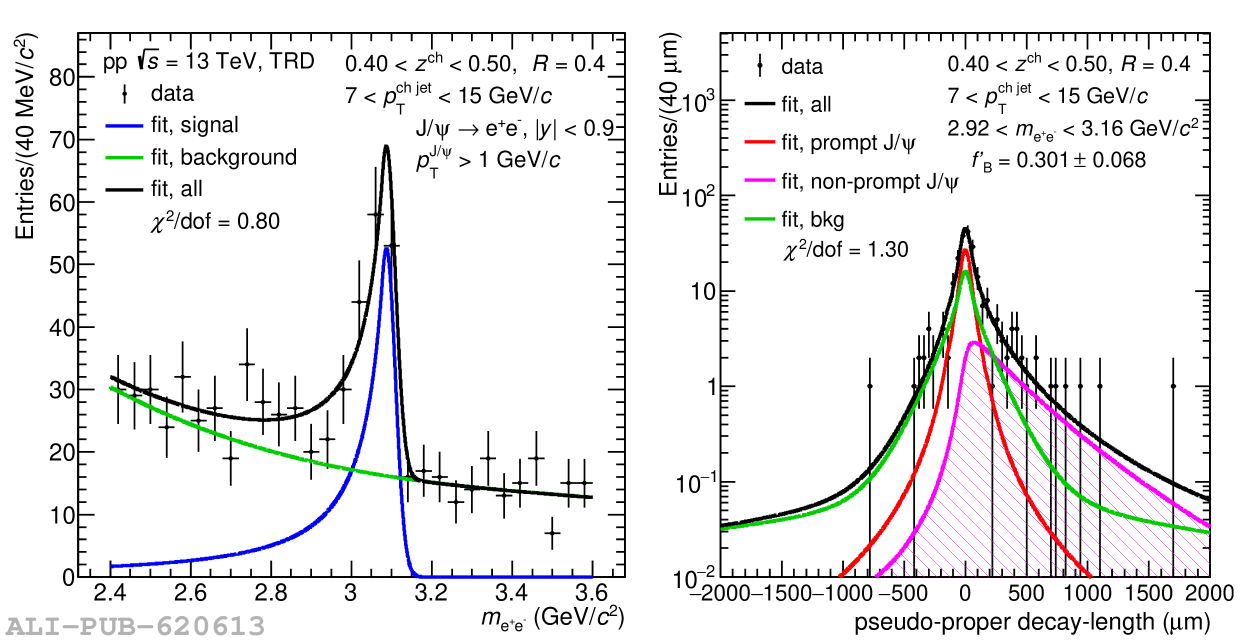 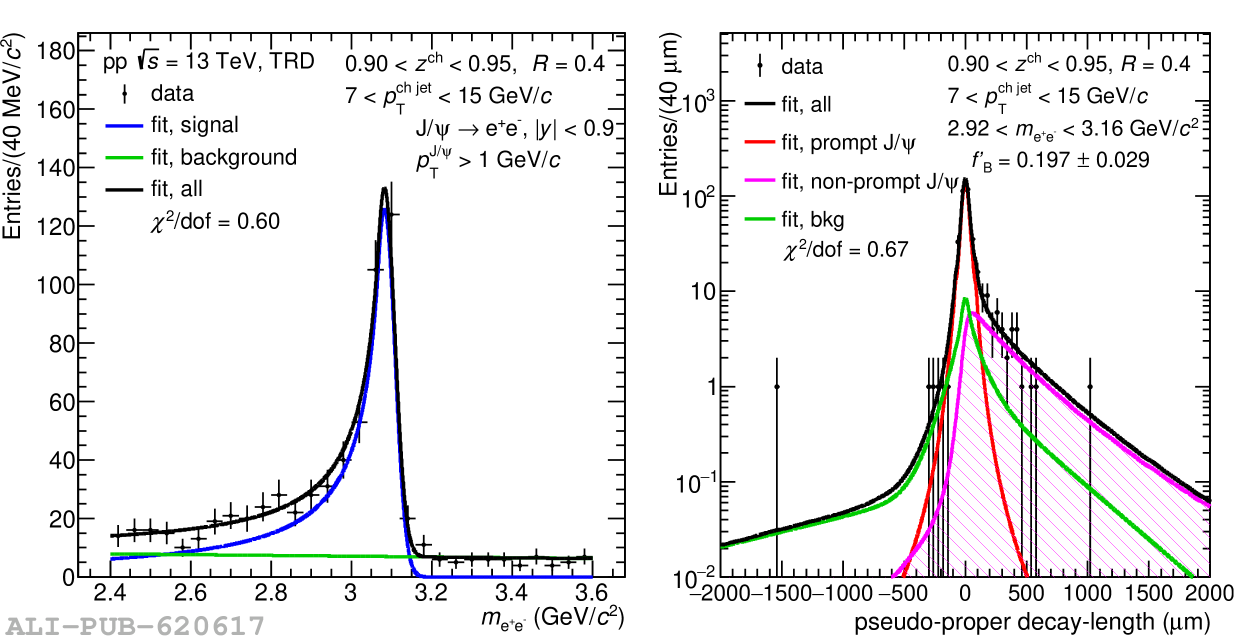 |
Figure 3
Detector-response matrix for jets containing a non-prompt \jpsi meson, representing the bin-migration probability as a function of the jet \ptjetch and \z. The $y$ axis represents the true \z in bins of true \ptjetch, and the $x$ axis shows the measured \z in bins of measured \ptjetch. |  |
Figure 4
Fully corrected, normalized prompt (left) and non-prompt (right) \jpsi transverse-momentum fraction (\z) measured in jets with $7\ptjetch 15$ \GeVc for $\ptjpsi > 1$ \GeVc in pp collisions at \thirteen. Measurements are compared to PYTHIA 8.311 calculations obtained using the Monash 2013 tune , where \jpsi are produced directly in parton--parton scatterings (black dotted line) and as a part of a parton shower (green dashed line) . The prompt-\jpsi distribution is compared to a model calculation from Zhang and Xing (cyan box). The error bars represent statistical uncertainties, while the boxes around the data points represent the total systematic uncertainty. |   |
Figure 5
Comparison of the measured prompt \jpsi transverse-momentum fraction (\z) measured in charged-particle jets with $7\ptjetch 15$ \GeVc for $\ptjpsi > 1$ \GeVc in pp collisions at \thirteen (red point) with the prompt-\jpsi transverse-momentum fraction ($z$) measured in full jets with $30\ptjet 40$ \GeVc for $\ptjpsi > 6.5$ \GeVc in pp collisions at \five reported by CMS (blue box) . The error bars represent statistical uncertainties, while the boxes around the data points represent the total systematic uncertainty. | 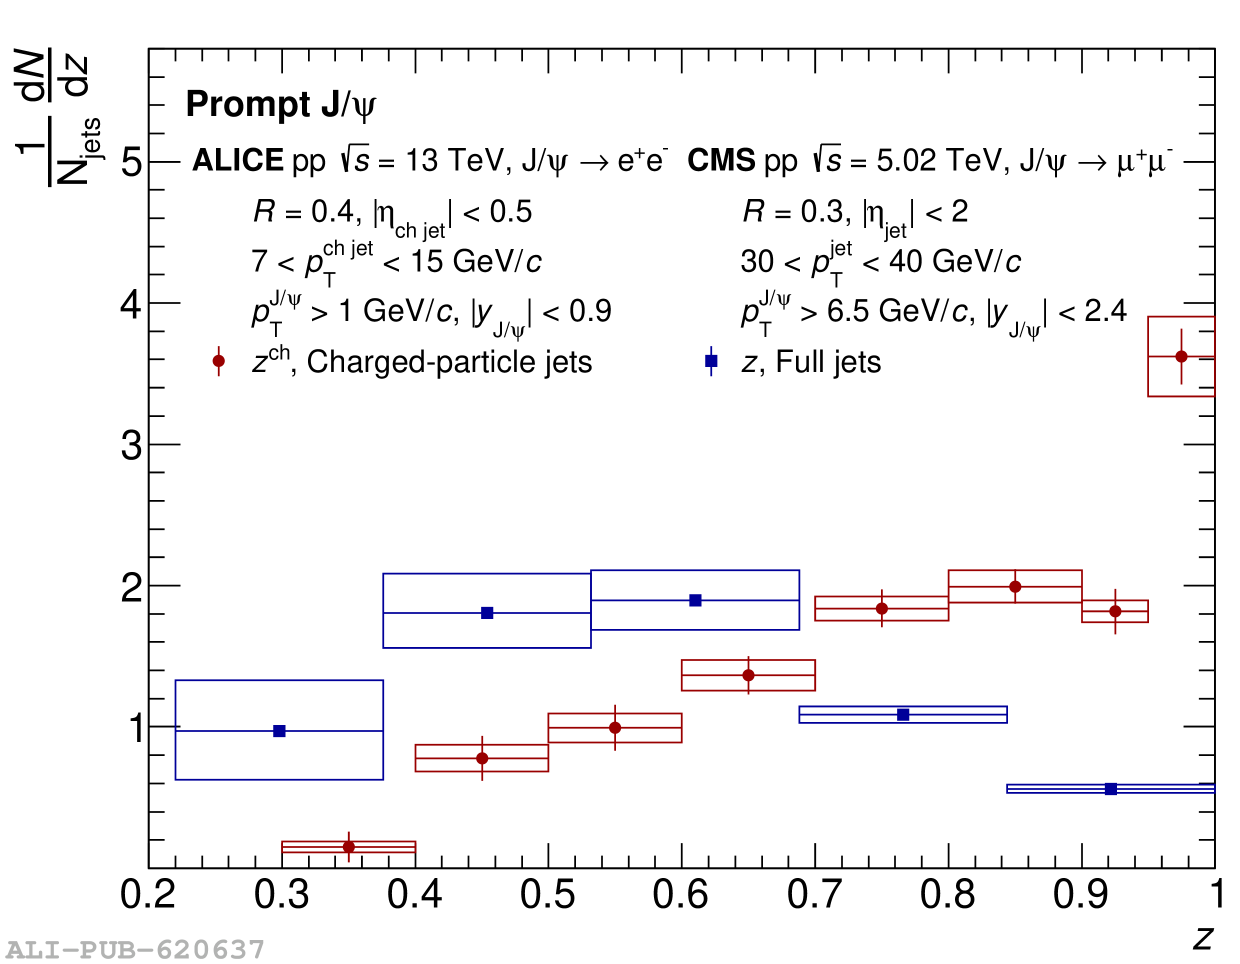 |