Measurements of the production of the W$^{\pm}$ and Z$^0$ bosons at midrapidity in pp collisions at $\sqrt{s} = 13$ TeV with ALICE at the Large Hadron Collider (LHC) are presented. The W$^{\pm}$ and Z$^0$ bosons are detected via their (di)electronic decay channels, with the electron reconstruction performed in the midrapidity region ($|y|<~ 0.6$). The $p_{\rm T}$-integrated and $p_{\rm T}$-differential production cross sections of electrons from W$^{\pm}$ decays in the interval $30 <~ p_{\rm T} <~ 60$ GeV/$c$, as well as the $p_{\rm T}$-integrated production cross section of Z$^0$ bosons, are measured. The results are described by perturbative QCD calculations using different sets of parton distribution functions. The production of W$^{\pm}$ bosons and azimuthally correlated associated hadrons is also measured as a function of the charged-particle multiplicity for the first time at the LHC. The former increases approximately linearly with the charged-particle multiplicity, while for the latter, there are hints of a faster-than-linear increase. These observations are compared with theoretical calculations.
Submitted to: EPJC
e-Print: arXiv:2602.22898 | PDF | inSPIRE
CERN-EP-2026-006
Figure group
Figure 1
Invariant-mass distribution of ${\rm e^{+}e^{-}}$ after background subtraction in pp collisions at $\sqrt s = 13$ TeV. The like-sign (open squares) and unlike-sign (open circles) distributions are also shown. The dashed lines indicate the fiducial mass interval used in this analysis. The vertical lines on the data points are the statistical uncertainties. | 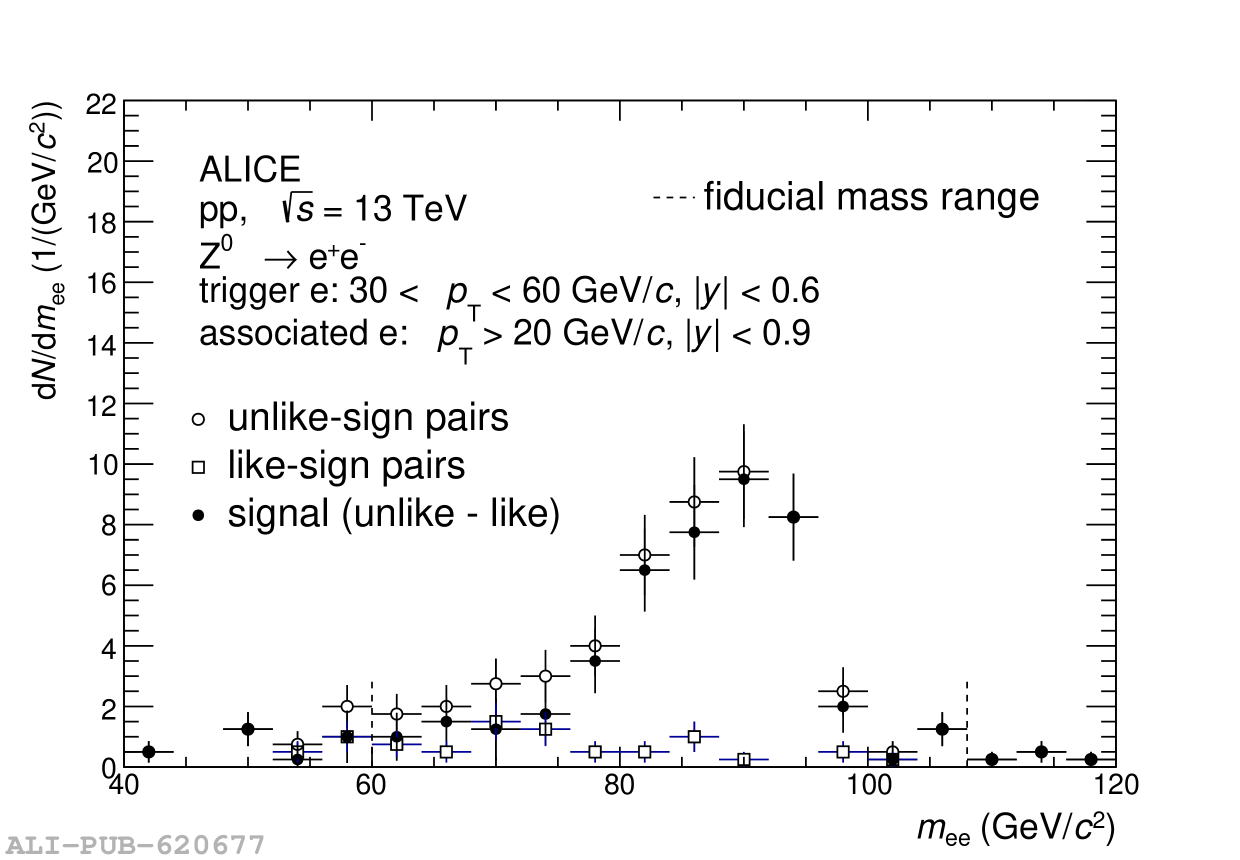 |
Figure 2
Raw $p_{\textrm{T}}$ distribution for e$^{-} \leftarrow \textrm{W}^{-}$ (left) and e$^{+} \leftarrow \textrm{W}^{+}$ (right) candidates after the isolation conditions together with the estimated background from heavy-flavour hadron decays and Z$^0$ decays in pp collisions at $\sqrt{s}=$ 13 TeV. The symbols are placed at the centre of the $p_{\rm T}$ interval. The statistical uncertainties are represented by vertical bars. |   |
Figure 3
Production cross section of $Z^{0}$ bosons in pp collisions at $\sqrt{s}=$ 13 {\TeV} within the acceptance of the ALICE central barrel, compared with POWHEG calculations performed with the CT14NNLO , NNPDF40 and CT18NLO PDF sets. Statistical and systematic uncertainties of the measurement are shown as a vertical line and an open box, respectively. | 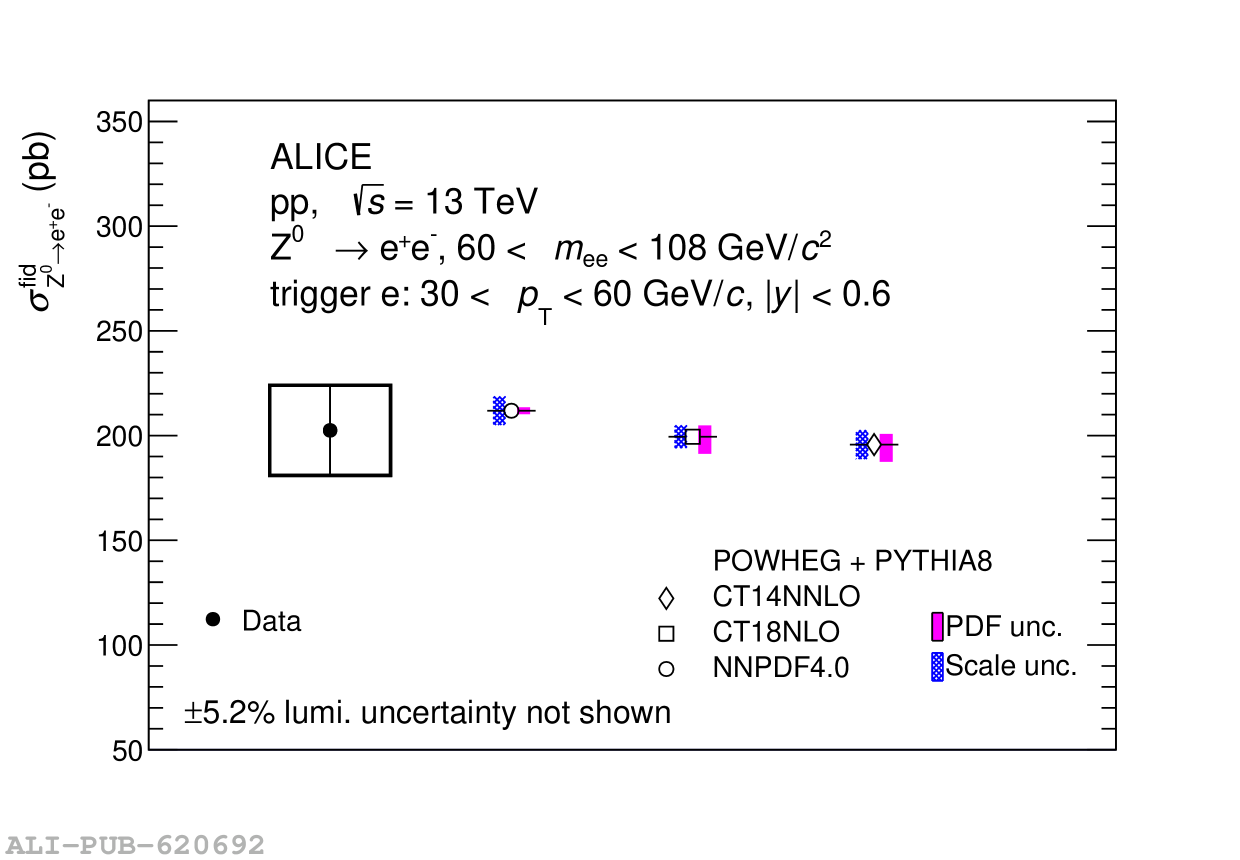 |
Figure 4
Production cross section of electrons from W$^{-}$ decays as a function of $p_{\rm T}$ at midrapidity in pp collisions at $\sqrt{s}=$13 {\TeV} compared with POWHEG calculations using the CT14NNLO (left), CT18NLO (middle) and NNPDF4.0 (right) PDF sets. The symbols are placed at the centre of the $p_{\rm T}$ interval. The statistical and systematic uncertainties of the measurement are shown as vertical lines and open boxes, respectively. The uncertainties of the theoretical calculations are shown as shaded bands. The ratio of the data to the POWHEG calculations is shown in the lower panels. | 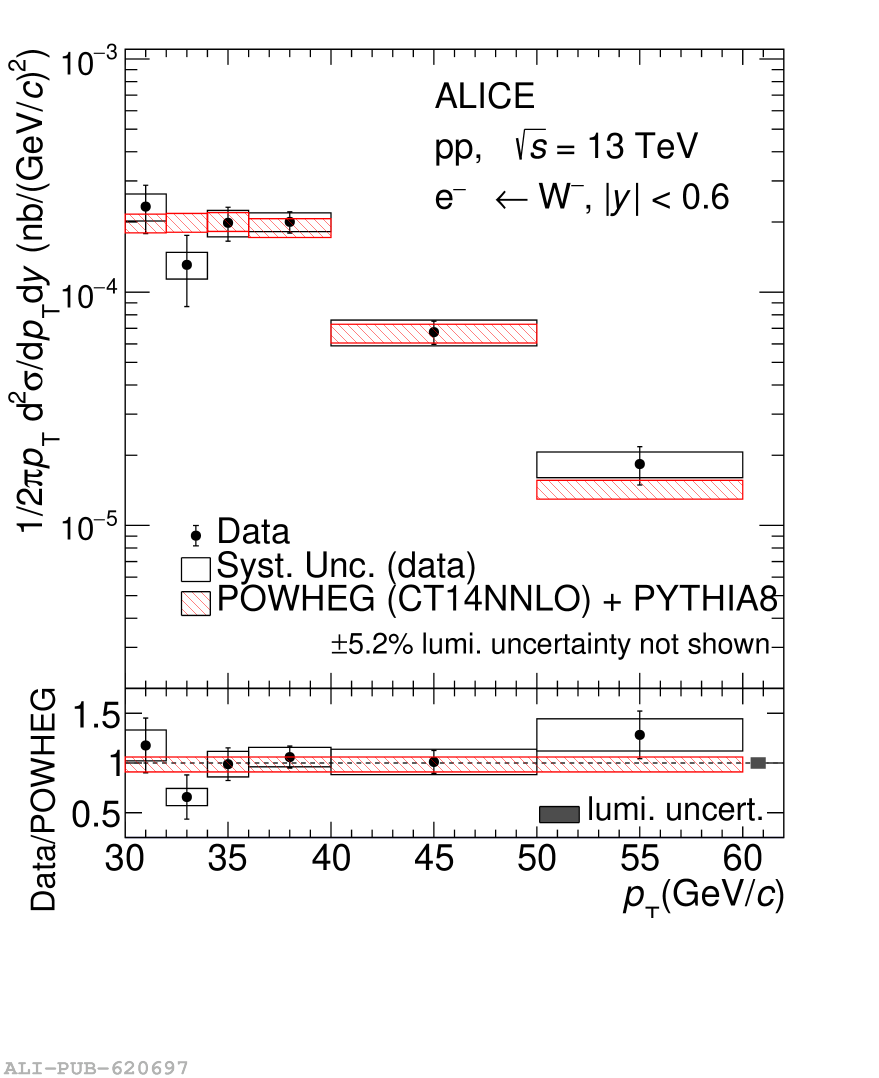   |
Figure 5
Production cross section of positrons from W$^{+}$decays as a function of $p_{\rm T}$ at midrapidity in pp collisions at $\sqrt{s}=$13 {\TeV} compared with POWHEG calculations using the CT14NNLO (left), CT18NLO (middle) and NNPDF4.0 (right) PDF sets. The symbols are placed at the centre of the $p_{\rm T}$ interval. The statistical and systematic uncertainties of the measurement are shown as vertical lines and open boxes, respectively. The uncertainties of the theoretical calculations are shown as shaded bands. The ratio of the data to the POWHEG calculations is shown in the lower panels. |   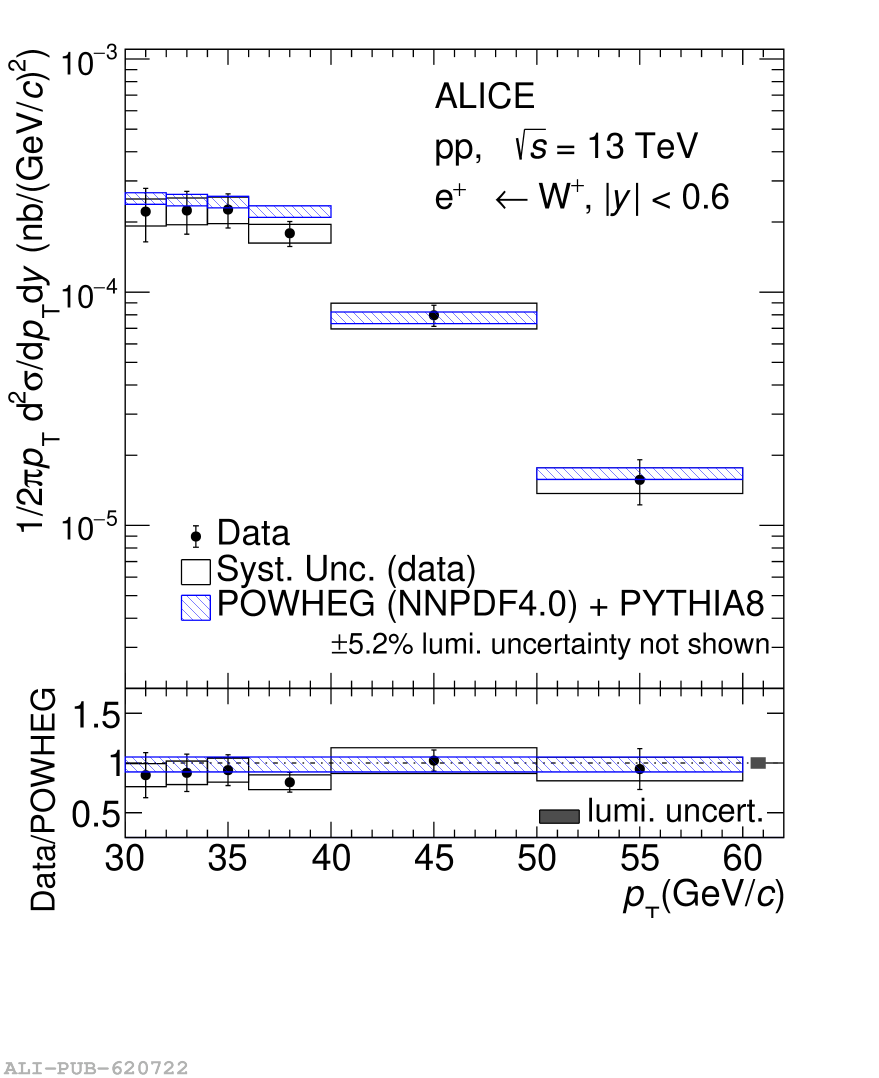 |
Figure 6
Ratio of the W$^+$ to W$^-$ production cross section as a function of $p_{\textrm{T}}$ at midrapidity in pp collisions at $\sqrt{s}=$ 13 TeV. The symbols are placed at the centre of the $p_{\rm T}$ interval. The statistical uncertainties are represented by vertical bars The curves with different colours are POWHEG calculations with the CT14NNLO , CT18NLO and NNPDF4.0 PDF sets. Uncertainties on the calculations are assumed to cancel in the ratio. | 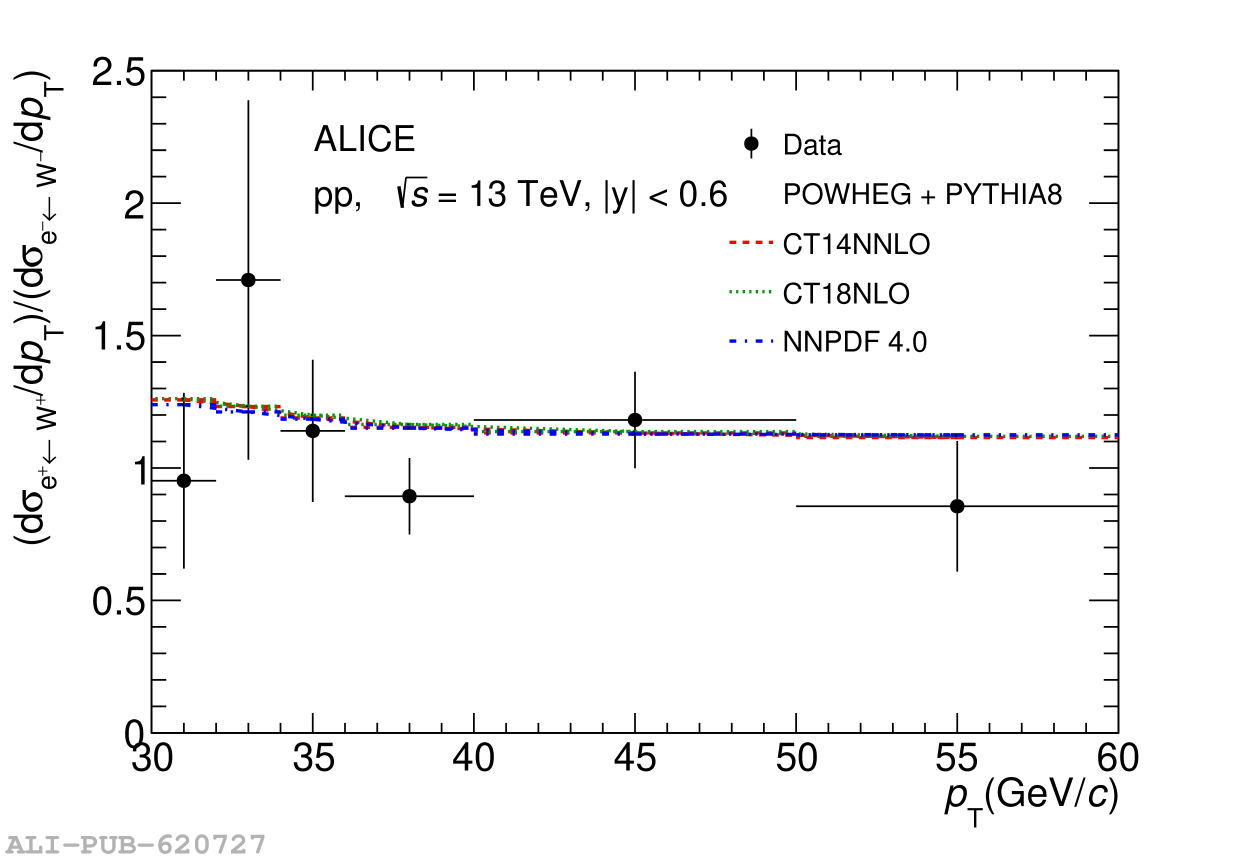 |
Figure 7
Production cross section of electrons from W$^{-}$ (left) and positrons from W$^{+}$ (right) decays at midrapidity in pp collisions at $\sqrt{s}=$13 {\TeV}, compared with POWHEG calculations with the CT14NNLO , CT18NLO and NNPDF4.0 PDF sets. The production cross sections are obtained by integrating e$^{\pm} \leftarrow \textrm{W}^{\pm}$ in the interval $30 p_{\rm T} 60$ GeV/$c$. Statistical and systematic uncertainties of the measurement are shown as a vertical line and an open box, respectively. |  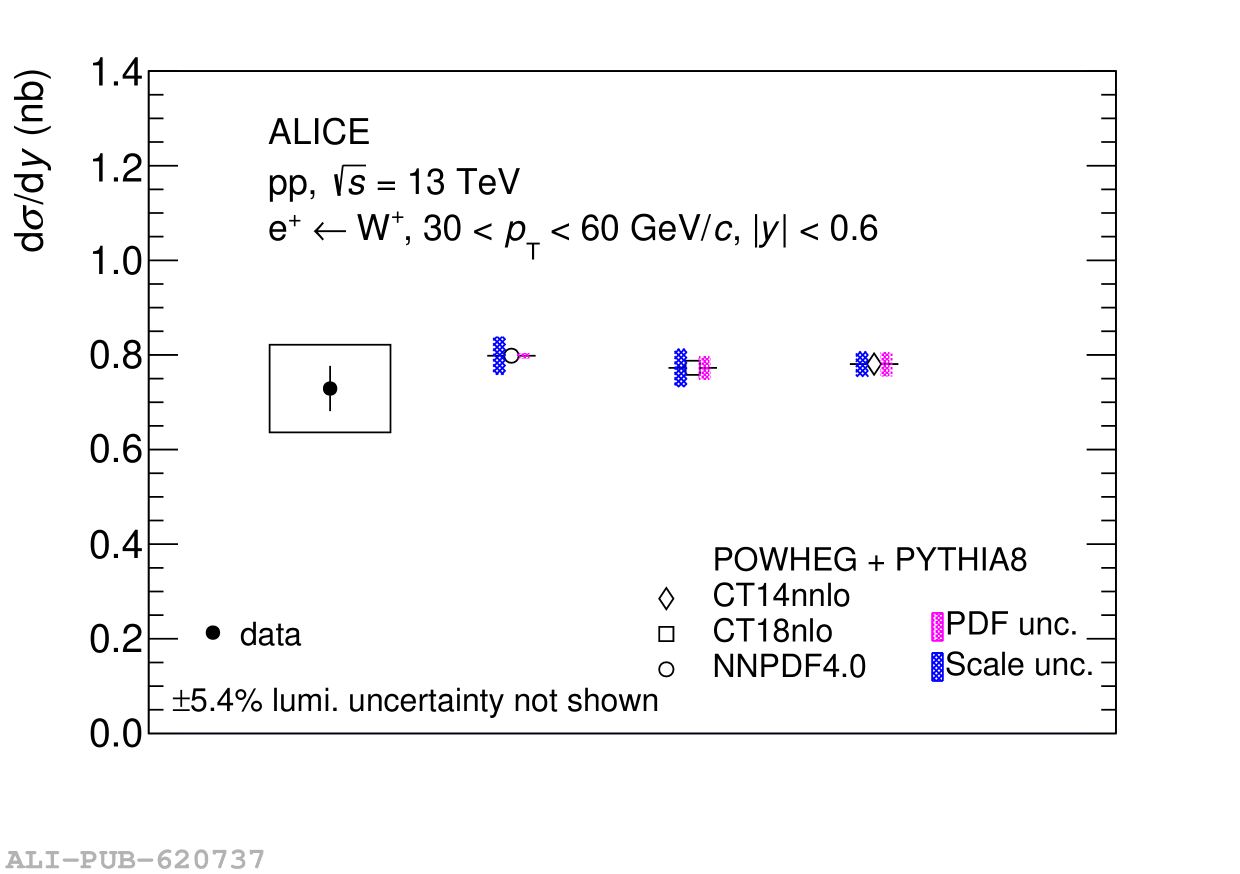 |
Figure 8
Left: Self-normalised yields of e$^{\pm}$ $\leftarrow$ W$^{\pm}$ and associated hadrons as a function of the normalised charged-particle pseudorapidity density. The linear behaviour $y=x$ is also shown as a dash-dotted line. The statistical and systematic uncertainties of the measurement are shown as vertical lines and open boxes, respectively. Right: Double ratio of the self-normalized yields of $e^{\pm} \leftarrow \textrm{W}^{\pm}$ to the self-normalised charged-particle multiplicity in pp collisions at $\sqrt{s}=$ 13 TeV. | 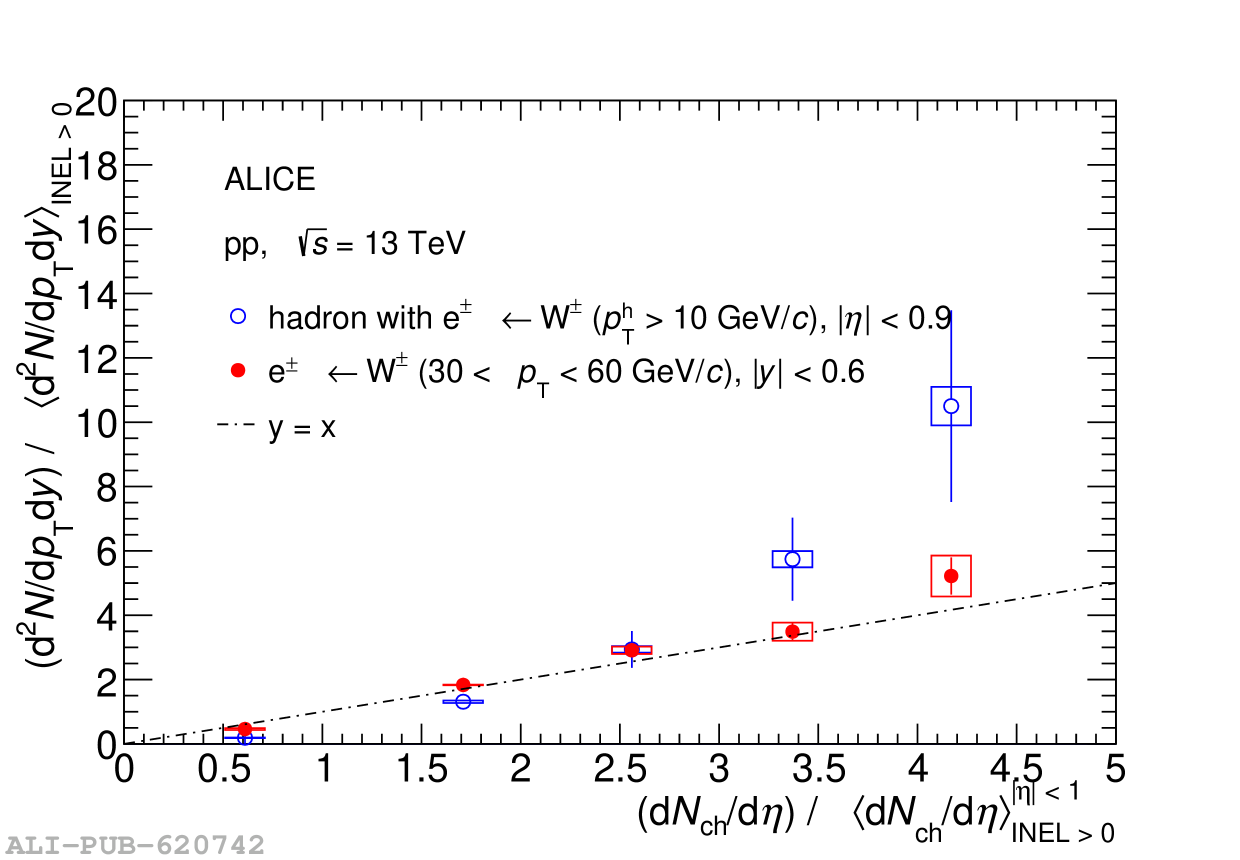 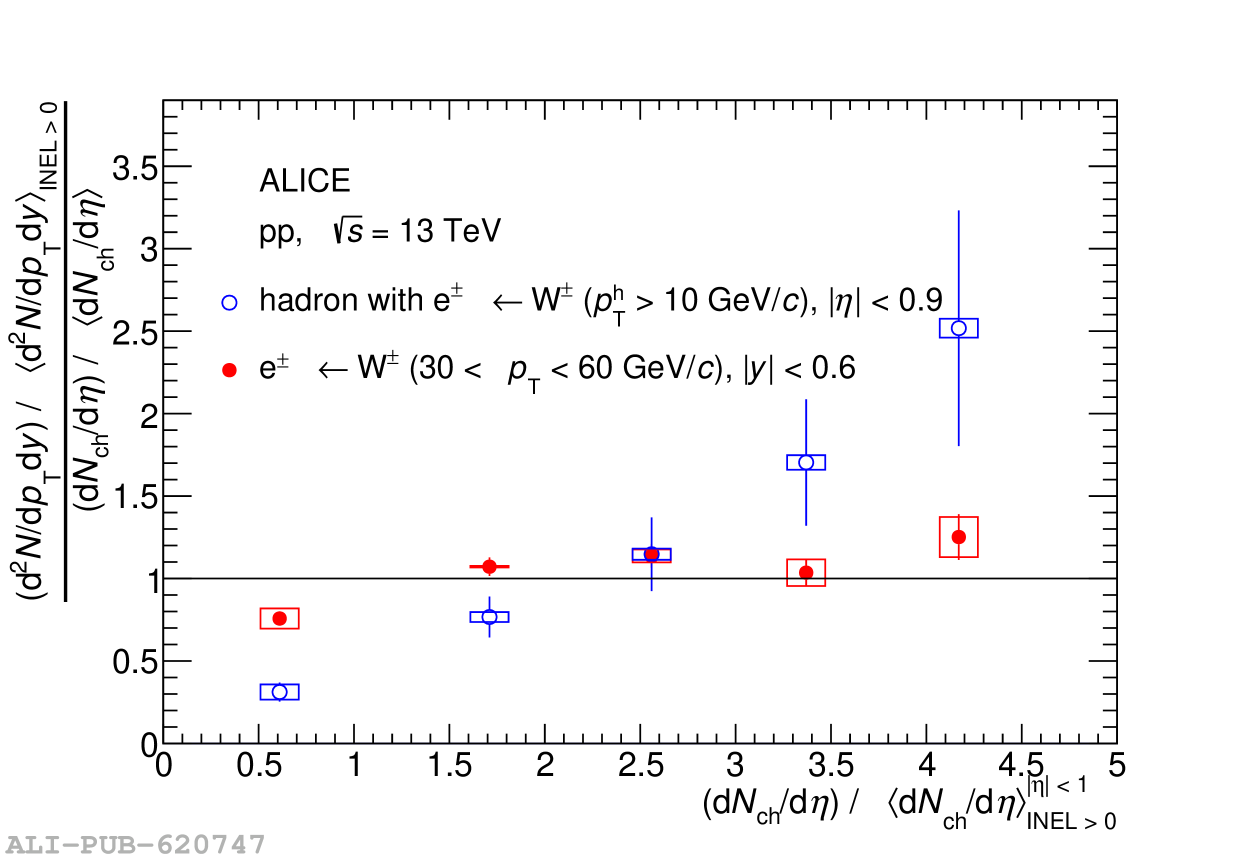 |
Figure 9
Left: Self-normalised yields of e$^{\pm}$ $\leftarrow$ W$^{\pm}$ and associated hadrons as a function of the normalised charged-particle pseudorapidity density at midrapidity in pp collisions at $\sqrt{s}=$ 13 TeV, compared with the expectations from PYTHIA 8 simulations including MPI and with/without CR effects. Right: self-normalised yields of e$^{\pm}$ $\leftarrow$ W$^{\pm}$ and associated hadrons compared with J/$\psi \rightarrow \textrm{e}^{+}\textrm{e}^{-}$ at midrapidity ($|y_{ee}|$ 0.9) and J/$\psi \rightarrow {\rm \mu^{+}\mu^{-}}$ at forward rapidity (2.5 $< y_ all yields being measured as a function of the self-normalised charged-particle pseudorapidity density at midrapidity. statistical and systematic uncertainties measurements are shown vertical lines open respectively.>< /y_> | 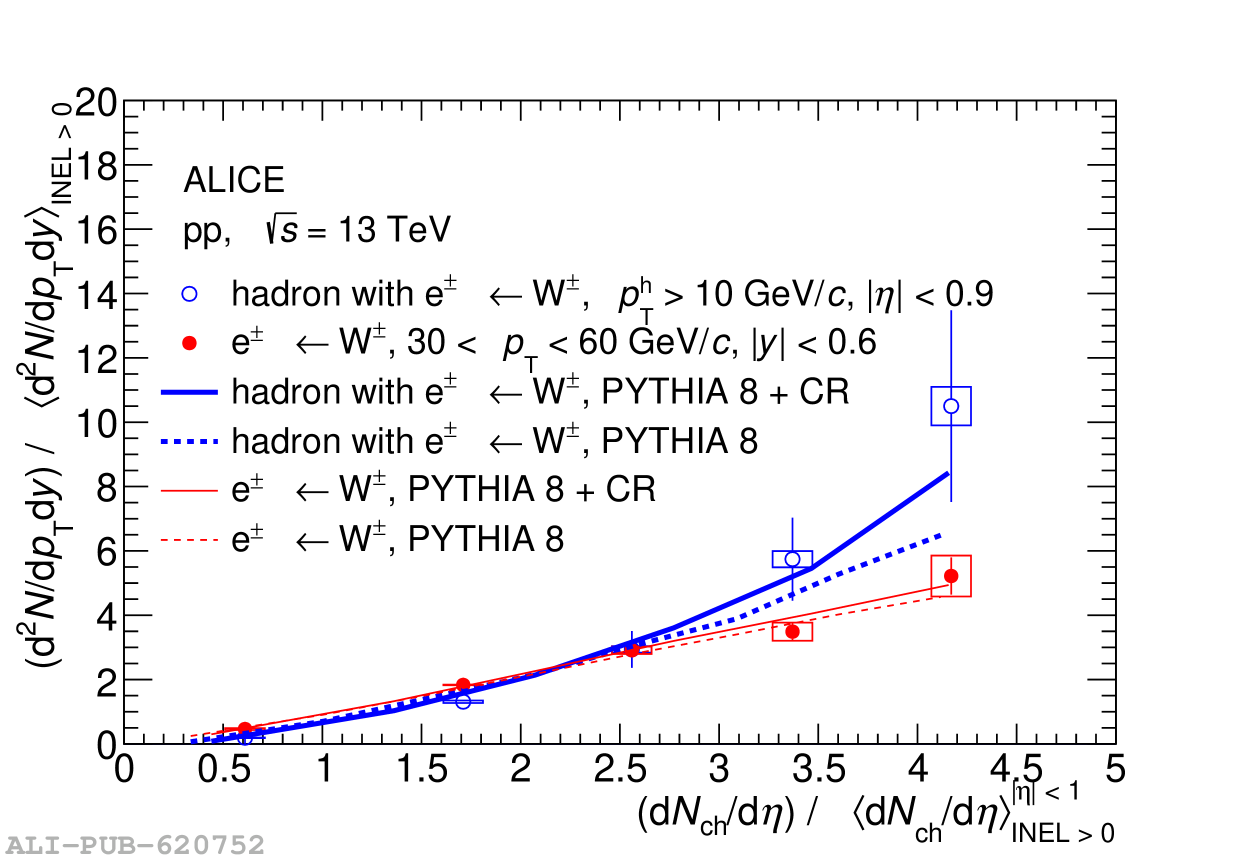 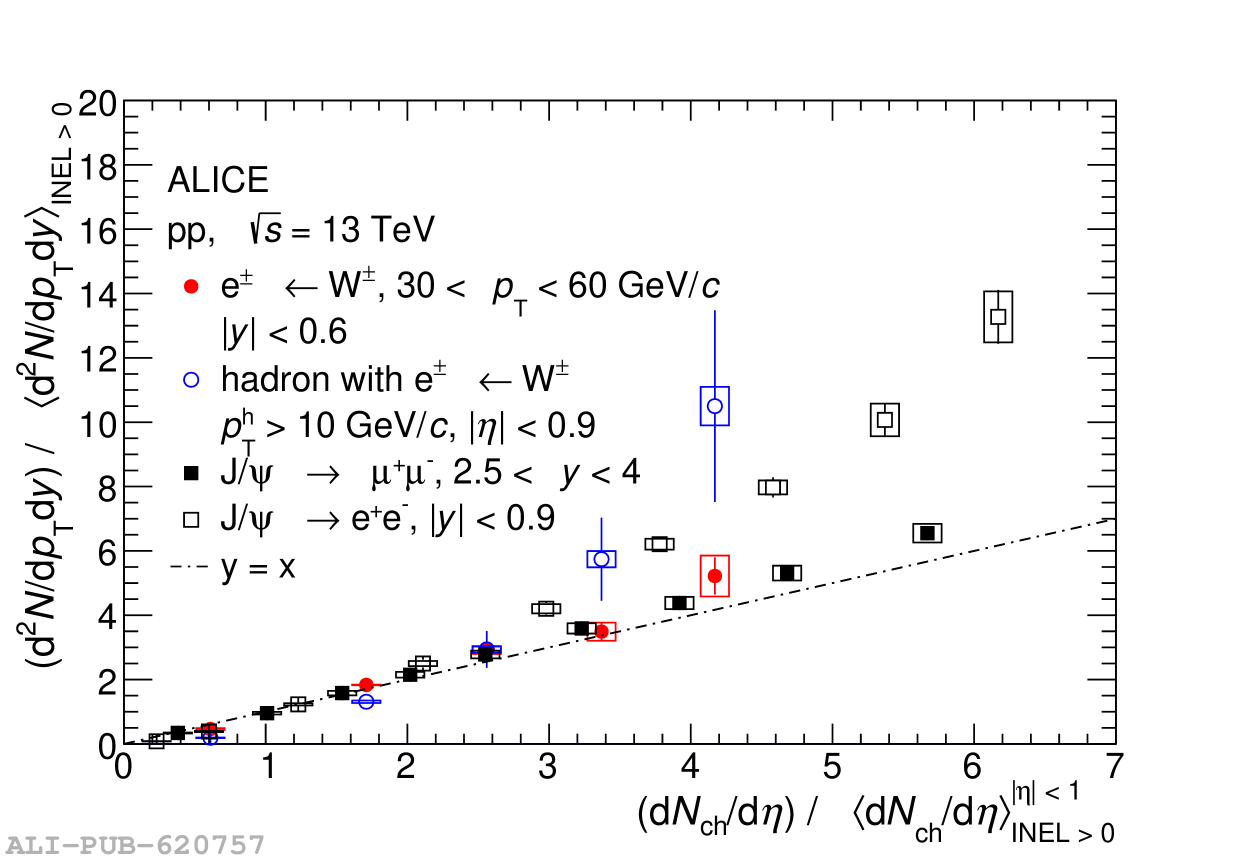 |