The distribution of the pseudorapidity density of primary charged particles (${\rm d}N_{\rm ch}/ {\rm d}η$) in $|η|<~1.5$ is measured in pp collisions at a center-of-mass energy of 13.6 TeV using the ALICE detector. Tracks are reconstructed with the upgraded Inner Tracking System and Time Projection Chamber, and results are reported for the INEL$>$0 event class (events having at least one charged particle in $|η|<~1$). The multiplicity dependence of the pseudorapidity density of charged particles is also explored with the multiplicity determined by the forward detectors. The average charged-particle pseudorapidity density at midrapidity ($|η|<~0.5$) is measured to be $\langle \mathrm{d}N_{\mathrm{ch}}/\mathrm{d}η\rangle = 7.10 \pm 0.18$. Combined with lower-energy measurements, the INEL$>$0 results follow a power-law scaling with the center-of-mass energy. These measurements provide a new reference for charged-particle production at the highest proton$-$proton collision energy available at the LHC.
Submitted to: PRD
e-Print: arXiv:2602.10658 | PDF | inSPIRE
CERN-EP-2026-012
Figure group
Figure 1
The pseudorapidity distribution of primary charged particles for INEL>0 events in pp collisions at $\sqrt{s} = 13.6$ TeV. Data are compared to model predictions from PYTHIA 8 Monash 2013 and EPOS4 with their variations. The systematic uncertainties in the data are represented by gray bands. The lower panel shows the ratio of model predictions to the data. | 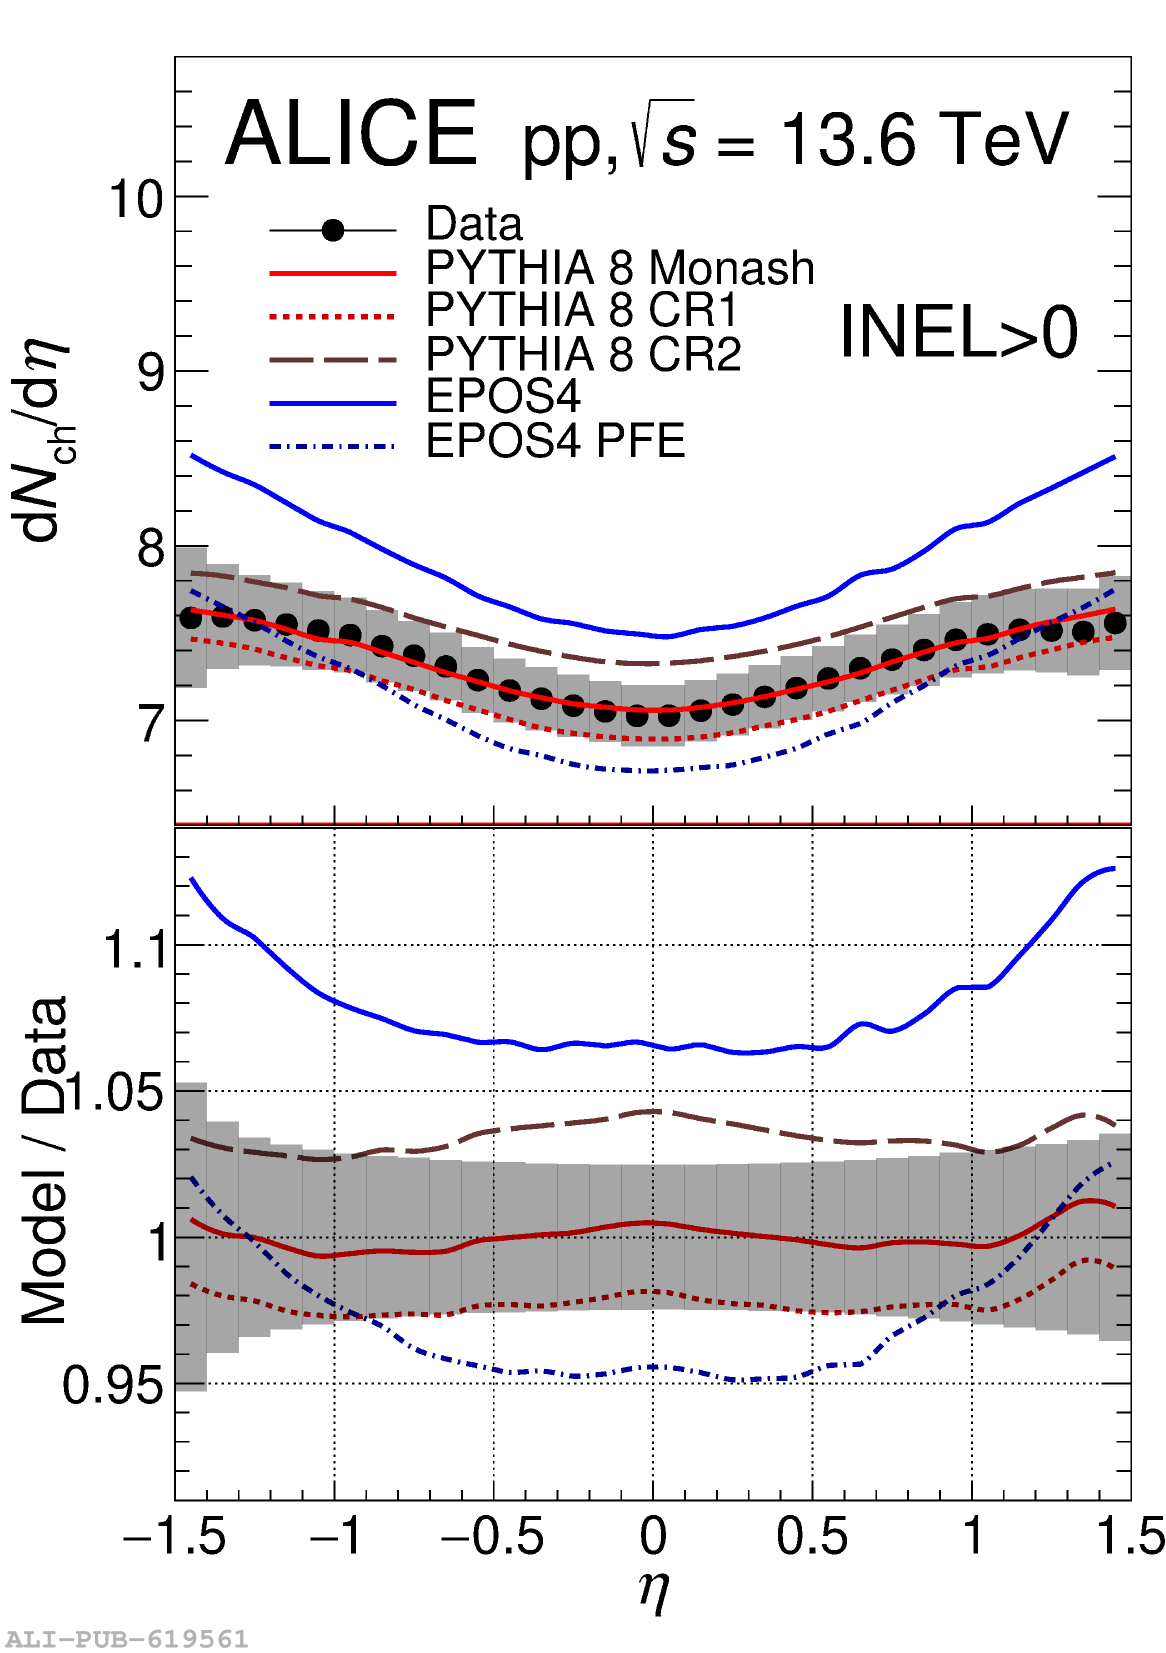 |
Figure 2
The values of $\langle \mathrm{d}N_\mathrm{ch} / \mathrm{d}\eta \rangle$ in $|\eta|< 0.5$ for the INEL, NSD, and INEL>0 event classes as a function of center-of-mass energy. The lines depict a power-law fit for each event class. The gray bands show one standard deviation of the fit where the errors are quite small. The $\langle \mathrm{d}N_\mathrm{ch} / \mathrm{d}\eta \rangle$ value for INEL>0 events in pp collisions at $\sqrt{s}=13.6$ TeV is included (the red star symbol). Note that the newly added data point is not included in the fit. | 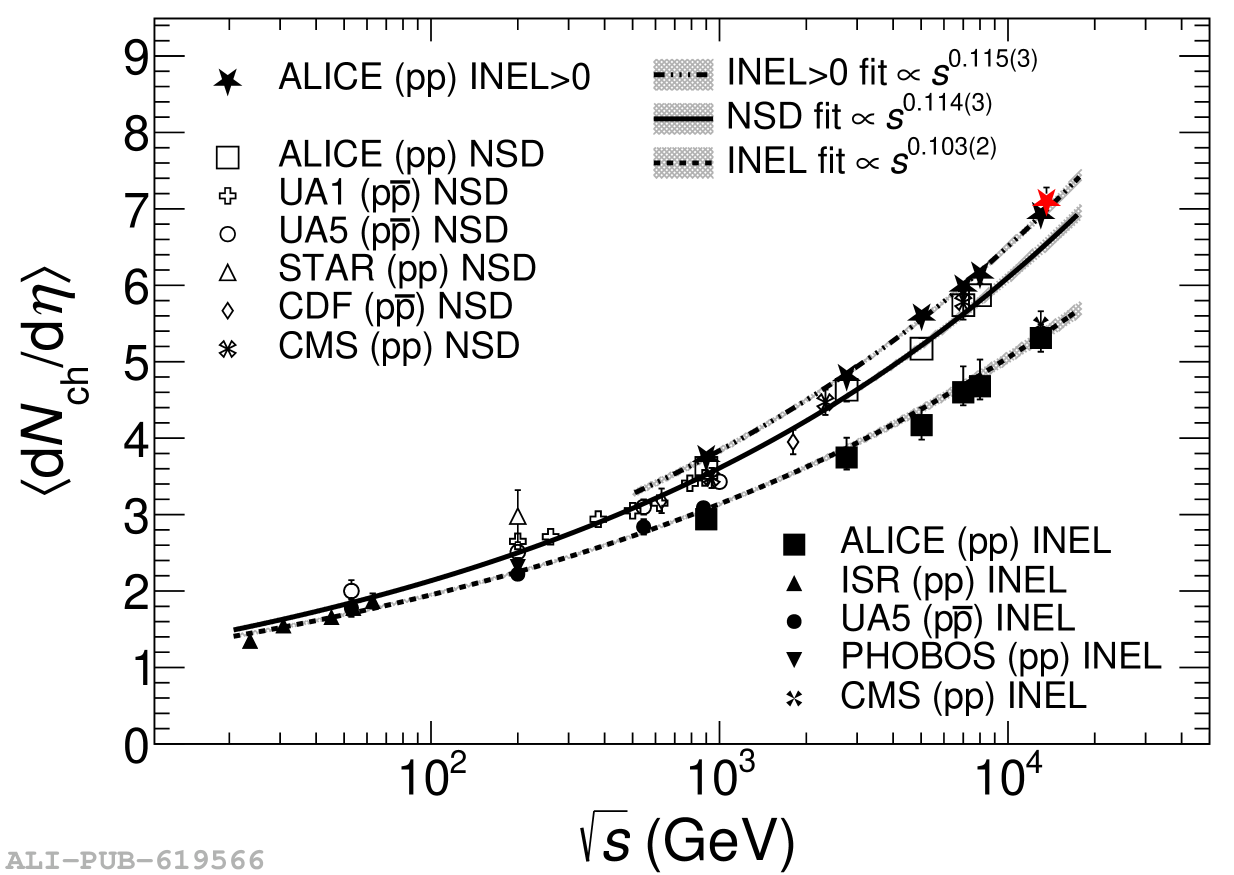 |
Figure 3
Charged-particle pseudorapidity density as a function of $\eta$ for the 0--1 to 70--100\% multiplicity classes measured with the forward multiplicity estimator, illustrating the dependence of particle production on forward event activity. Higher event activity classes exhibit an overall increase in charged-particle multiplicity, while the shape of the distributions remains consistent across different multiplicity classes. | 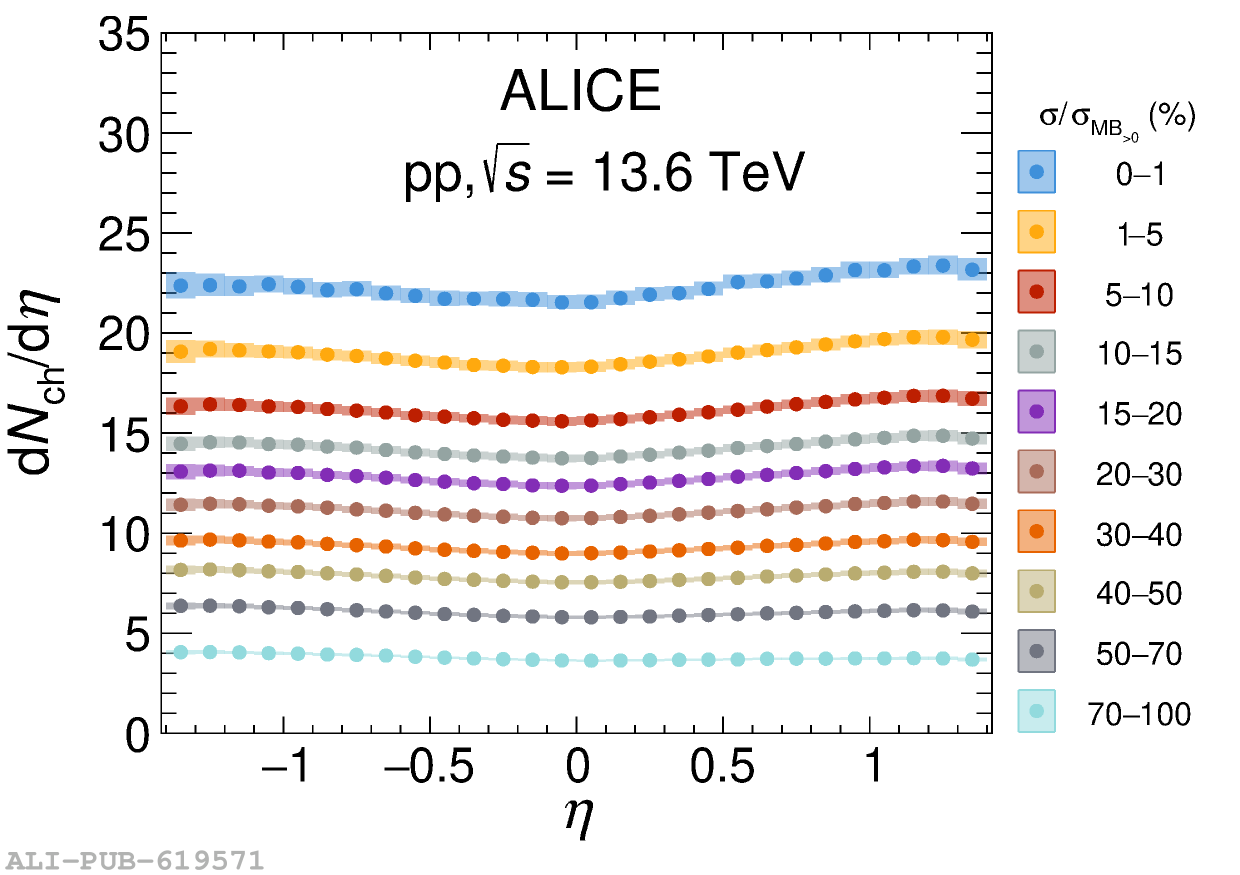 |
Figure 4
$\mathrm{d}N_\mathrm{ch} / \mathrm{d}\eta $ distributions for different multiplicity classes in pp collisions at $\sqrt{s}=13.6$ TeV. The top, third and fifth rows present $\mathrm{d}N_\mathrm{ch} / \mathrm{d}\eta $ distributions from the 0-1% to the 70-100% multiplicity classes, and the other rows display the model-to-data ratios of the rows above. The distributions are compared with theoretical predictions from PYTHIA 8 and EPOS4 with their variations. Note that the multiplicity classes in the models correspond to INEL>0, and multiplicity classes in the data correspond to MB>0 classification as listed in Tab.2. | 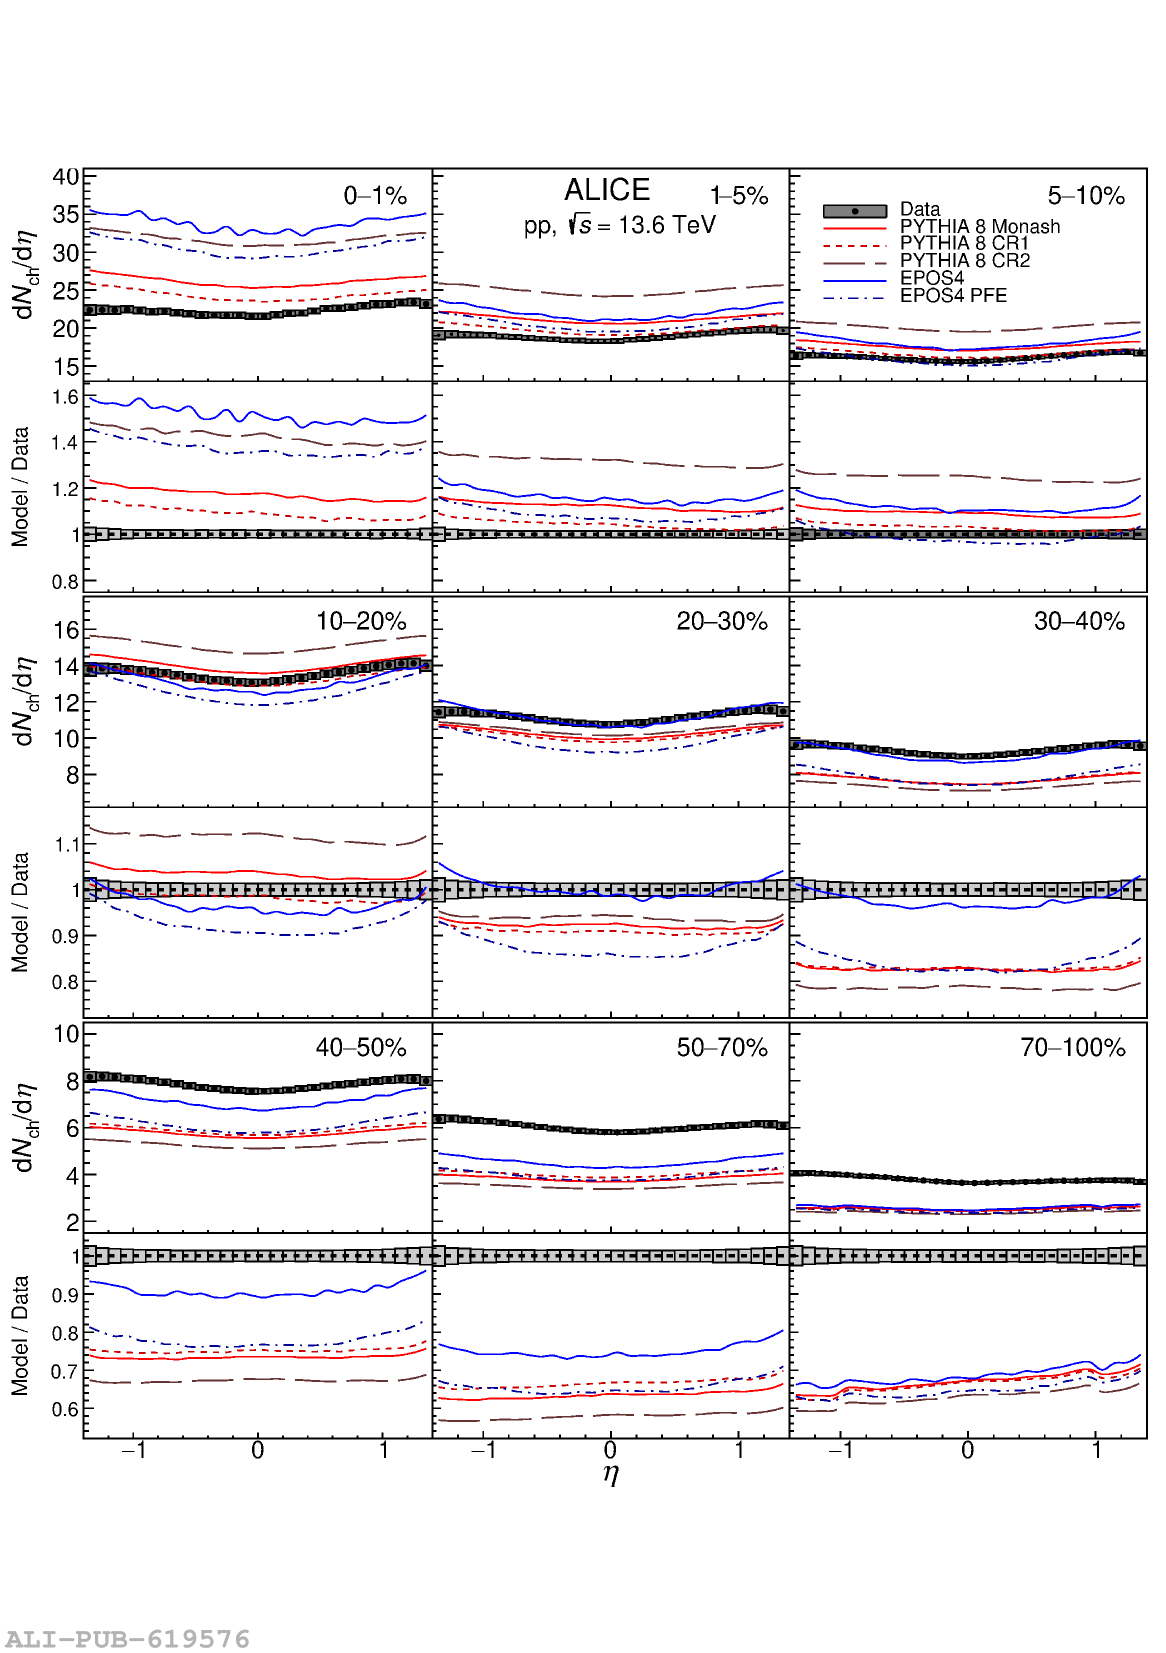 |