Measurements of transverse momentum ($p_{\rm T}$) and pseudorapidity ($η$) dependent flow vector fluctuations in p$-$Pb collisions at $\sqrt{s_{_{\rm NN}}} = 5.02$ TeV at the CERN Large Hadron Collider are presented. By studying long-range two-particle correlations with a template fit method, potential biases from non-flow effects such as jets and resonance decays are effectively suppressed. Significant $p_{\rm T}$- and $η$-dependent fluctuations of the second-harmonic flow vector are observed with more than 5$σ$ confidence in p$-$Pb collisions, similar to the observations in Pb$-$Pb collisions. The influence of residual non-flow effects has been evaluated and cannot account for the observed fluctuations, thereby confirming the observation of flow vector fluctuations in small collision systems at the LHC. Comparisons to model calculations from 3DGlauber+MUSIC+UrQMD and the parton transport model from AMPT are also presented. The measurements provide constraints on the theoretical modelling of the three-dimensional initial geometry and its event-by-event fluctuations, offering critical insights into the origin of collective flow in small collision systems at the LHC.
Accepted by: JHEP
HEP Data
e-Print: arXiv:2602.10645 | PDF | inSPIRE
CERN-EP-2026-014
Figure group
Figure 1
The ratio $v_2\{{\rm 2PC}\}/v_2[{\rm 2PC}]$ in p--Pb collisions at $\snn$ = 5.02 TeV as a function of transverse momentum (red points). Statistical (systematic) uncertainties are represented by solid bars (filled boxes). Calculations from AMPT with string melting and 3DGlauber+MUSIC+UrQMD are shown as textured and plain bands, respectively. |  |
Figure 2
The ratio $v_2\{{\rm 2PC}\}/v_2[{\rm 2PC}]$ in p--Pb collisions at $\snn$ = 5.02 TeV as a function of transverse momentum, for 0--20\% V0A (red points), 20--40\% V0A (blue points) and 40--60\% V0A (green points) (top panel). The ratio with respect to the measurements in 0--20\% V0A is also presented (bottom panel). Statistical (systematic) uncertainties are represented by vertical bars (filled boxes). Calculations from AMPT with string melting and 3DGlauber+MUSIC+UrQMD are shown as textured and plain bands, respectively. The ratio results from AMPT are not shown in the bottom panel due to excessively large statistical uncertainties. |  |
Figure 3
Results for $r_2(p_{\rm T}^{\rm a},p_{\rm T}^{\rm b})$ in p--Pb collisions at $\snn$ = 5.02 TeV as a function of transverse momentum (red points). The different panels display results for different $\pt^{\rm a}$ ranges. Statistical (systematic) uncertainties are represented by vertical bars (filled boxes). Calculations from AMPT with string melting and 3DGlauber+MUSIC+UrQMD are shown as textured and plain bands, respectively. |  |
Figure 4
Results for $r_2(p_{\rm T}^{\rm a},p_{\rm T}^{\rm b})$ in p--Pb collisions at $\snn$ = 5.02 TeV as a function of transverse momentum for 0--20\% V0A (red points), 20--40\% V0A (blue points) and 40--60\% V0A (green points). Statistical (systematic) uncertainties are represented by vertical bars (filled boxes). Calculations from 3DGlauber+MUSIC+UrQMD are shown as plain bands. The results from AMPT are not shown due to excessively large statistical uncertainties. | 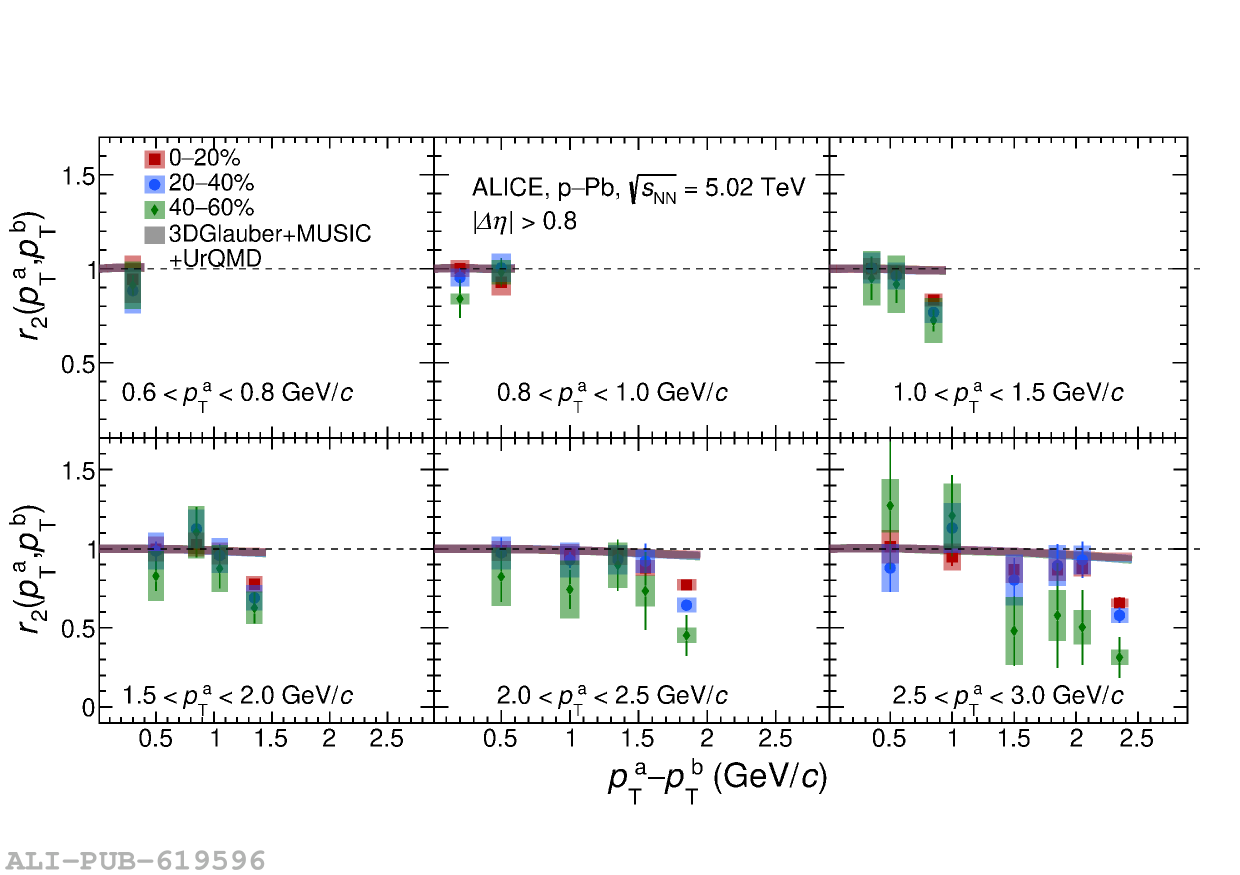 |
Figure 5
Results for $R_{2}(\eta^{\rm a}, \eta^{\rm b})$ in p--Pb collisions at $\snn$ = 5.02 TeV as a function of $|\eta^{\rm a}|$ (red squares). Statistical (systematic) uncertainties are represented by vertical bars (filled boxes). Calculations from AMPT with string melting and 3DGlauber+MUSIC+UrQMD are shown as filled shadows and solid lines. |  |
Figure 6
Results for $R_{2}(\eta^{\rm a}, \eta^{\rm b})$ in p--Pb collisions at $\snn$ = 5.02 TeV as a function of $|\eta^{\rm a}|$ with $1.8|\eta^{\rm b}|2.6$ (blue stars) and $2.6|\eta^{\rm b}|3.2$ (red crosses). Statistical (systematic) uncertainties are represented by vertical bars (filled boxes). Calculations from AMPT with string melting and 3DGlauber+MUSIC+UrQMD are shown as textured and plain bands, respectively. | 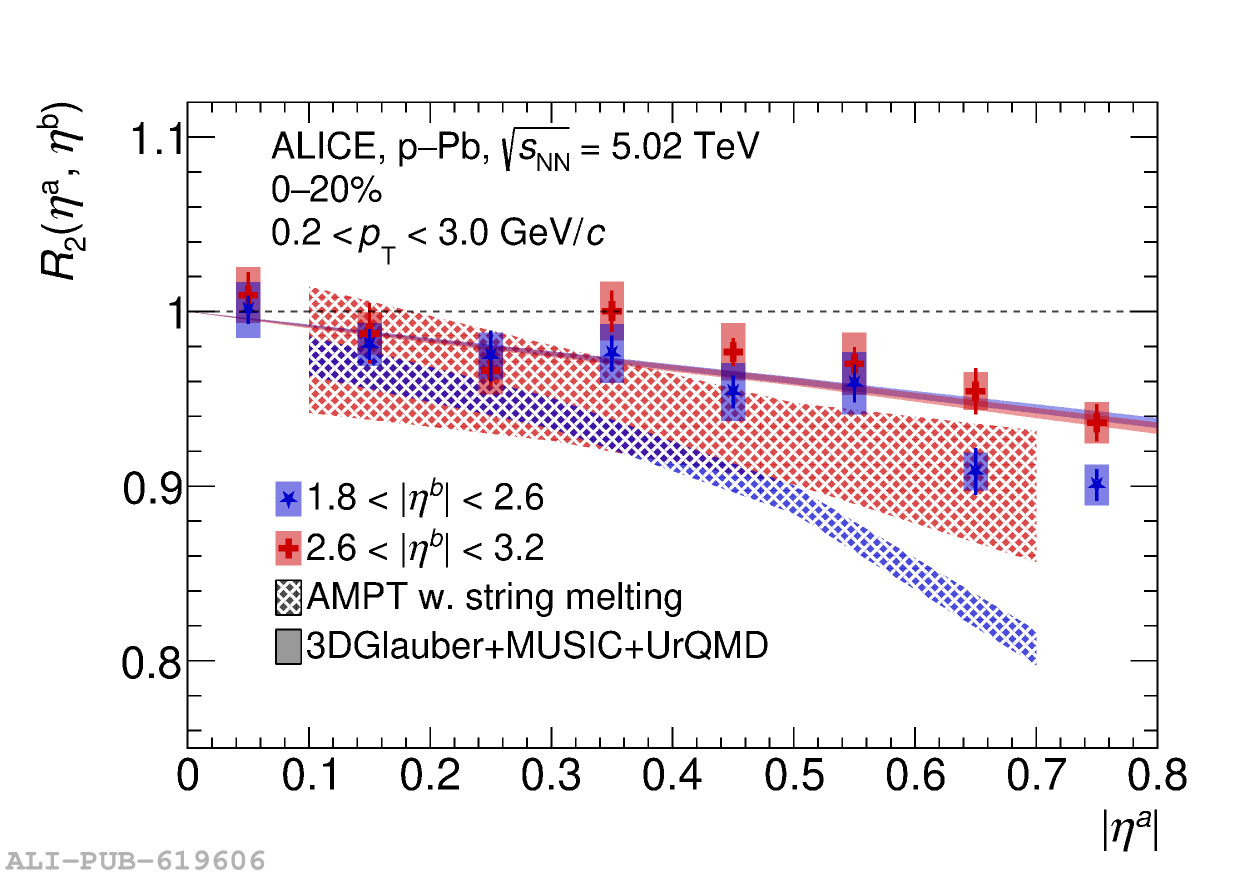 |
Figure 7
Results for $R_{2}(\eta^{\rm a}, \eta^{\rm b})$ in p--Pb collisions at $\snn$ = 5.02 TeV as a function of transverse momentum, with $1.8\eta^{\rm b}3.2$ and for V0A 0--20\% (red squares), 20--40\% (blue circles) and 40--60\% (green diamonds). Statistical (systematic) uncertainties are represented by vertical bars (filled boxes). Calculations from AMPT with string melting and 3DGlauber+MUSIC+UrQMD are shown as textured and plain bands, respectively. | 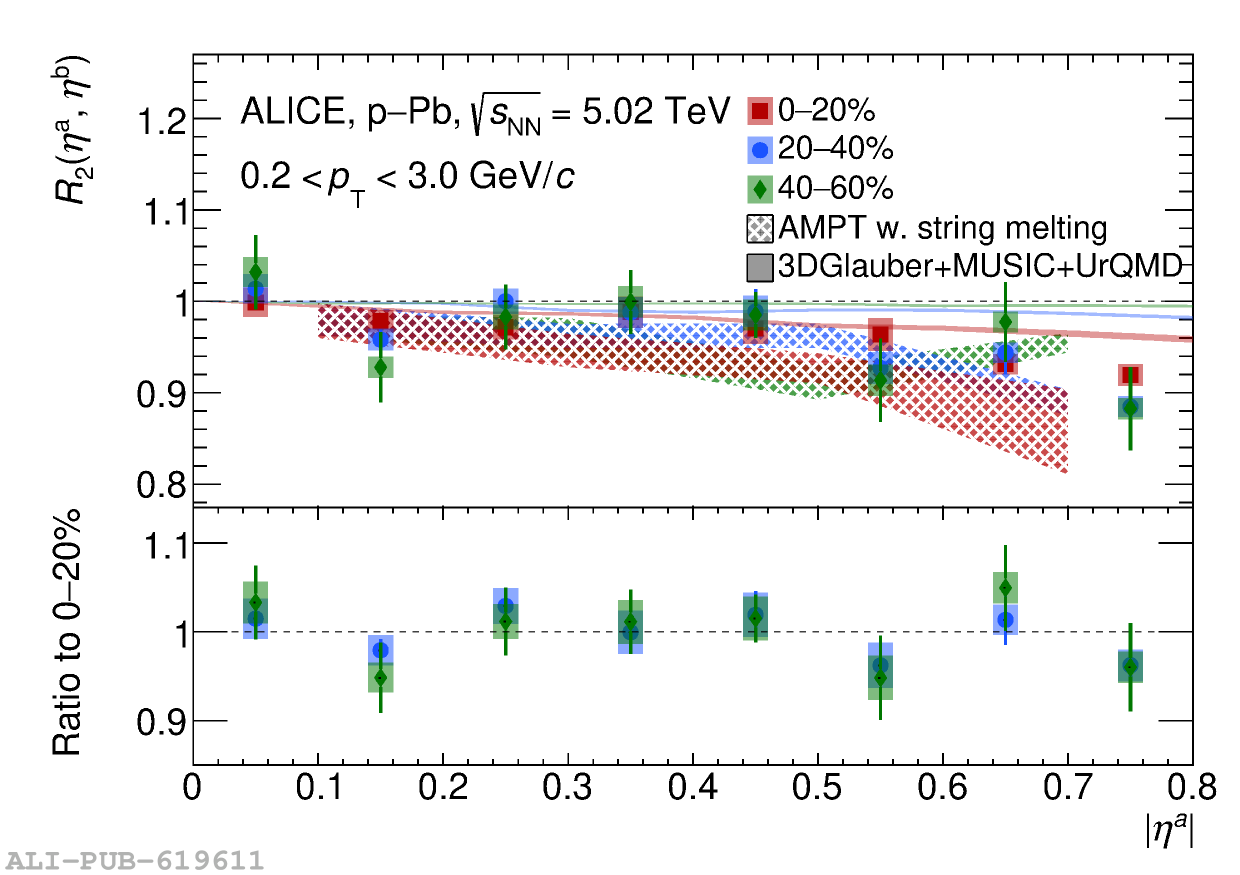 |