The measurement of three-dimensional femtoscopic correlations between identical charged kaons (K$^\pm$K$^\pm$) produced in p$-$Pb collisions at center-of-mass energy per nucleon pair $\sqrt{s{_{\rm NN}}} = 5.02$ TeV with ALICE at the LHC is presented for the first time. This measurement, supplementary to those in pp and Pb$-$Pb collisions, allows understanding the particle-production mechanisms at different charged-particle multiplicities and provides information on the dynamics of the source of particles created in p$-$Pb collisions, for which a general consensus does not yet exist. It is shown that the measured source sizes increase with charged-particle multiplicity and decrease with increasing pair transverse momentum. These trends for K$^\pm$K$^\pm$ are similar to the ones observed earlier in identical charged-pion and K$_{\rm s}^{0}$K$_{\rm s}^{0}$ correlations in Pb$-$Pb collisions at various energies and in $π^\pm π^\pm$ correlations in p$-$Pb collisions at $\sqrt{s{_{\rm NN}}} = 5.02$ TeV. At comparable multiplicity, the source sizes measured in p$-$Pb collisions agree within uncertainties with those observed in pp collisions, and there is an indication that they are smaller than those observed in Pb$-$Pb collisions. The obtained results are also compared with predictions from the hadronic interaction model EPOS~3, which tends to underestimate the source size for the most central collisions and agrees with the data for semicentral and peripheral events. Furthermore, the time of maximal emission for kaons is extracted. It turns out to be comparable with the value obtained in highly peripheral Pb$-$Pb collisions at the same energy, indicating that the kaon emission evolution is similar to that in p$-$Pb collisions.
JHEP 2604 (2026) 113
HEP Data
e-Print: arXiv:2601.15081 | PDF | inSPIRE
CERN-EP-2025-237
Figure group
Figure 1
Single (left) and pair (right) K$^\pm$ purities for different event multiplicity classes. The systematic uncertainties associated with the purity estimation are shown as boxes. Statistical uncertainties are negligible. The momentum $p$ and $k_{\rm T}$ values for lower multiplicity classes (blue and green symbols) are slightly shifted for clarity. | 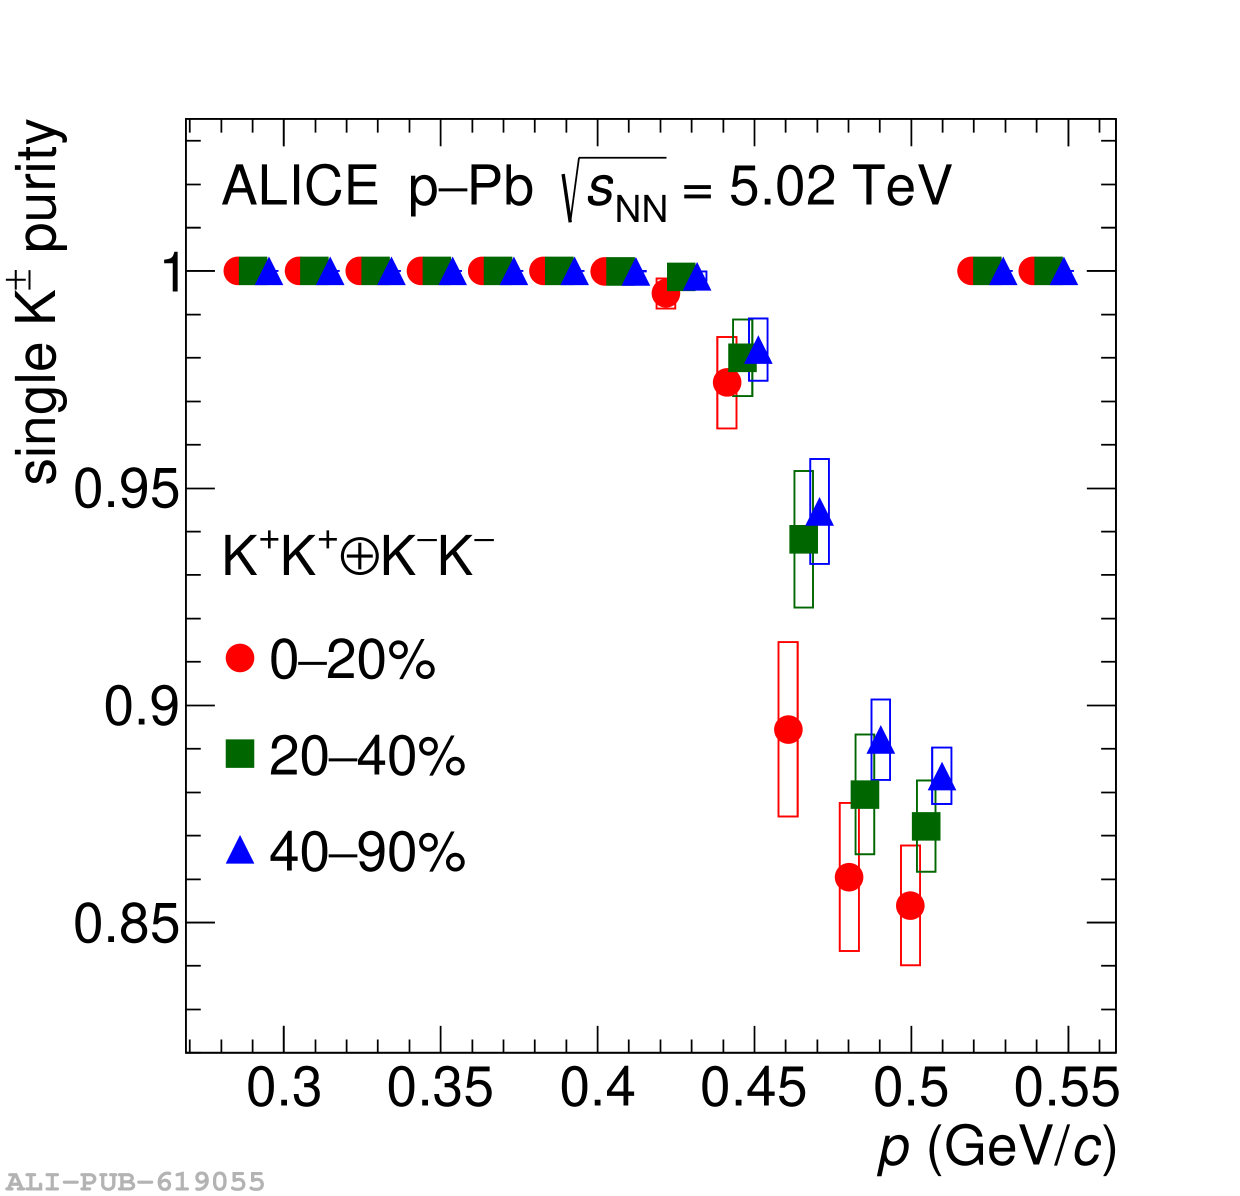 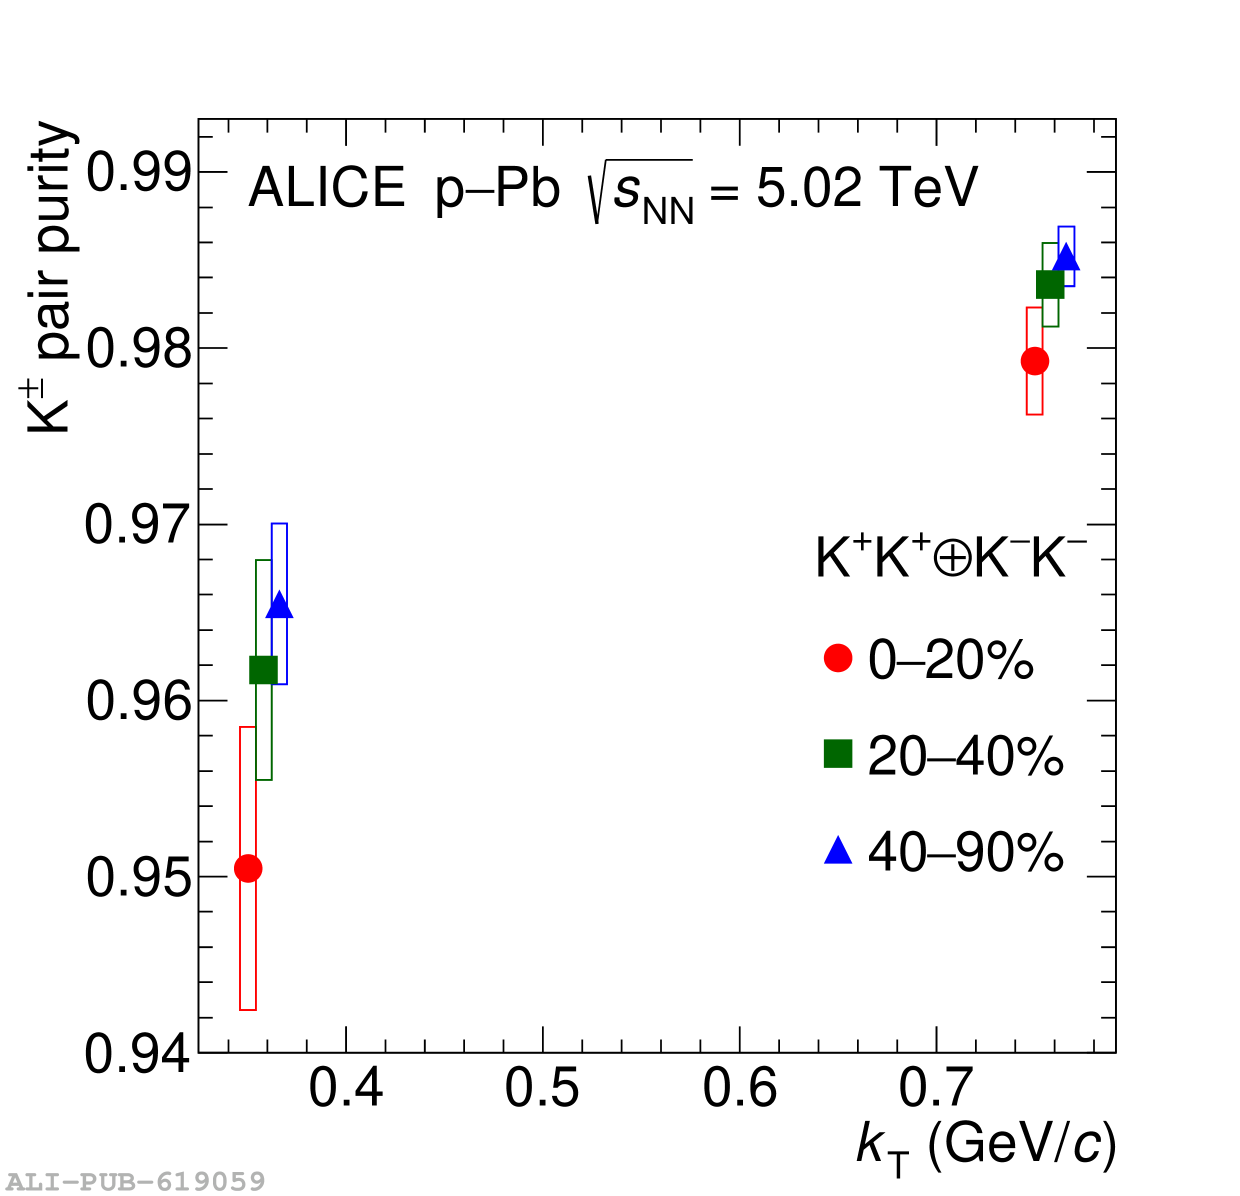 |
Figure 2
Projection of the 3D CF in the ${\rm out}$ direction (black full circles) in three multiplicity classes and two $k_{\rm T}$ ranges fitted (red solid lines) with Eq. (5). Statistical (systematic) uncertainties are shown by bars (boxes). The data are integrated over the range of $|q_i|< 0.15$ GeV$/c$ in the non-projected coordinates. Vertical lines not belonging to any marker around $|q_{\rm out}|=0.6$ GeV$/c$ are very-large error bars of data points that are out of the chosen $Y$ axis range. | 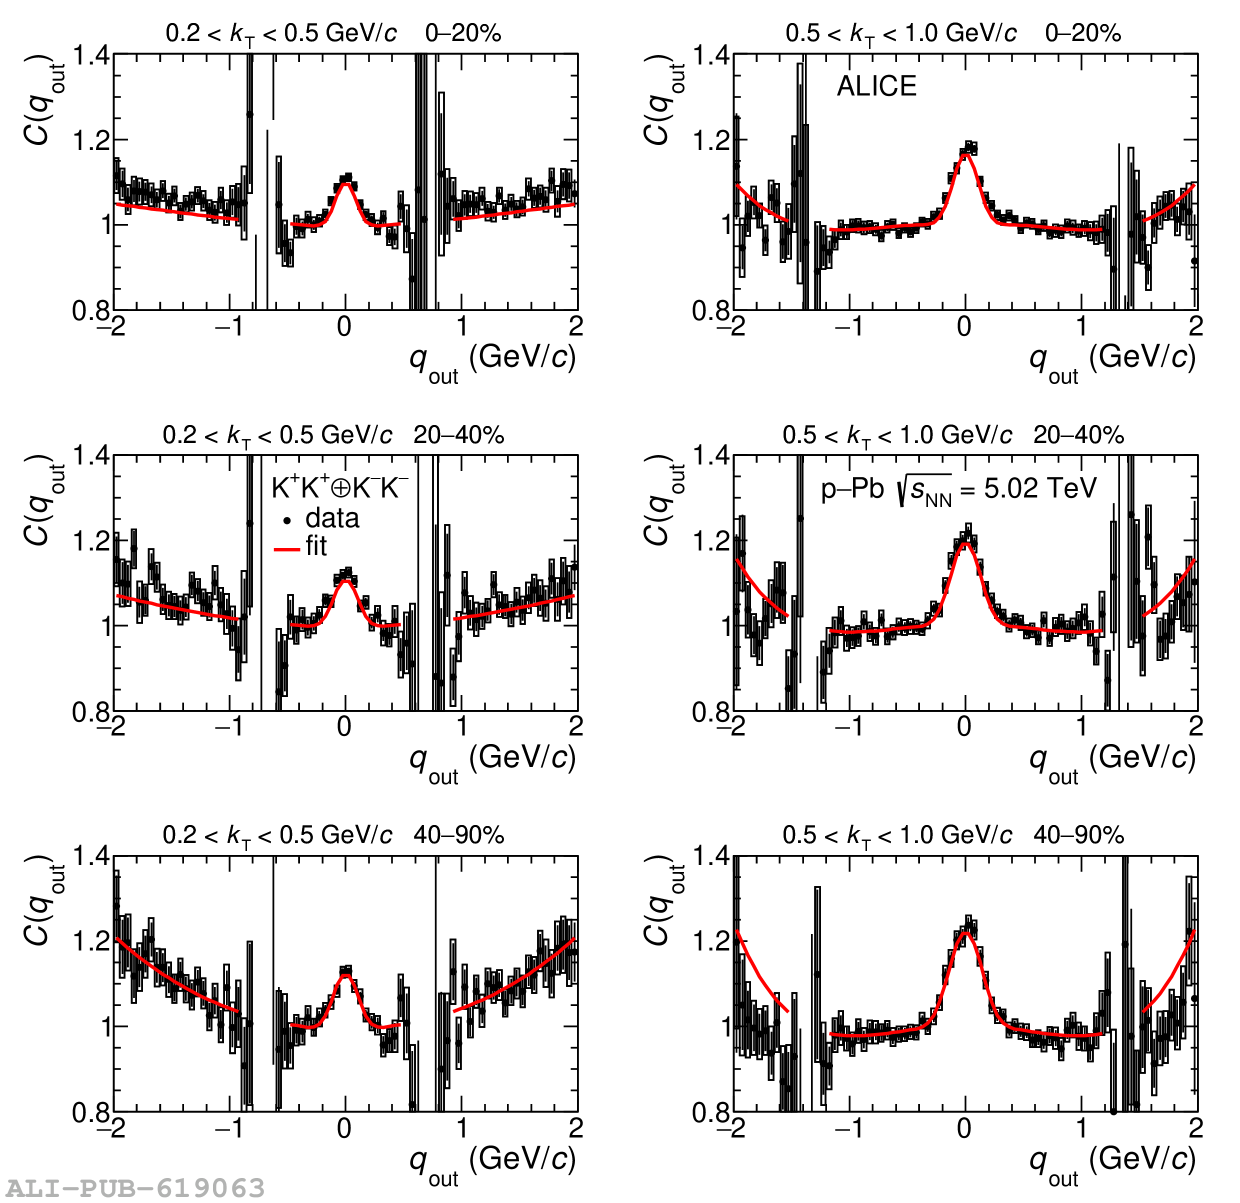 |
Figure 3
Projection of the 3D CF in the ${\rm side}$ direction (black full circles) in three multiplicity classes and two $k_{\rm T}$ ranges fitted (red solid lines) with Eq. (5). Statistical (systematic) uncertainties are shown by bars (boxes). The data are integrated over the range of $|q_i|< 0.15$ GeV$/c$ in the non-projected coordinates. | 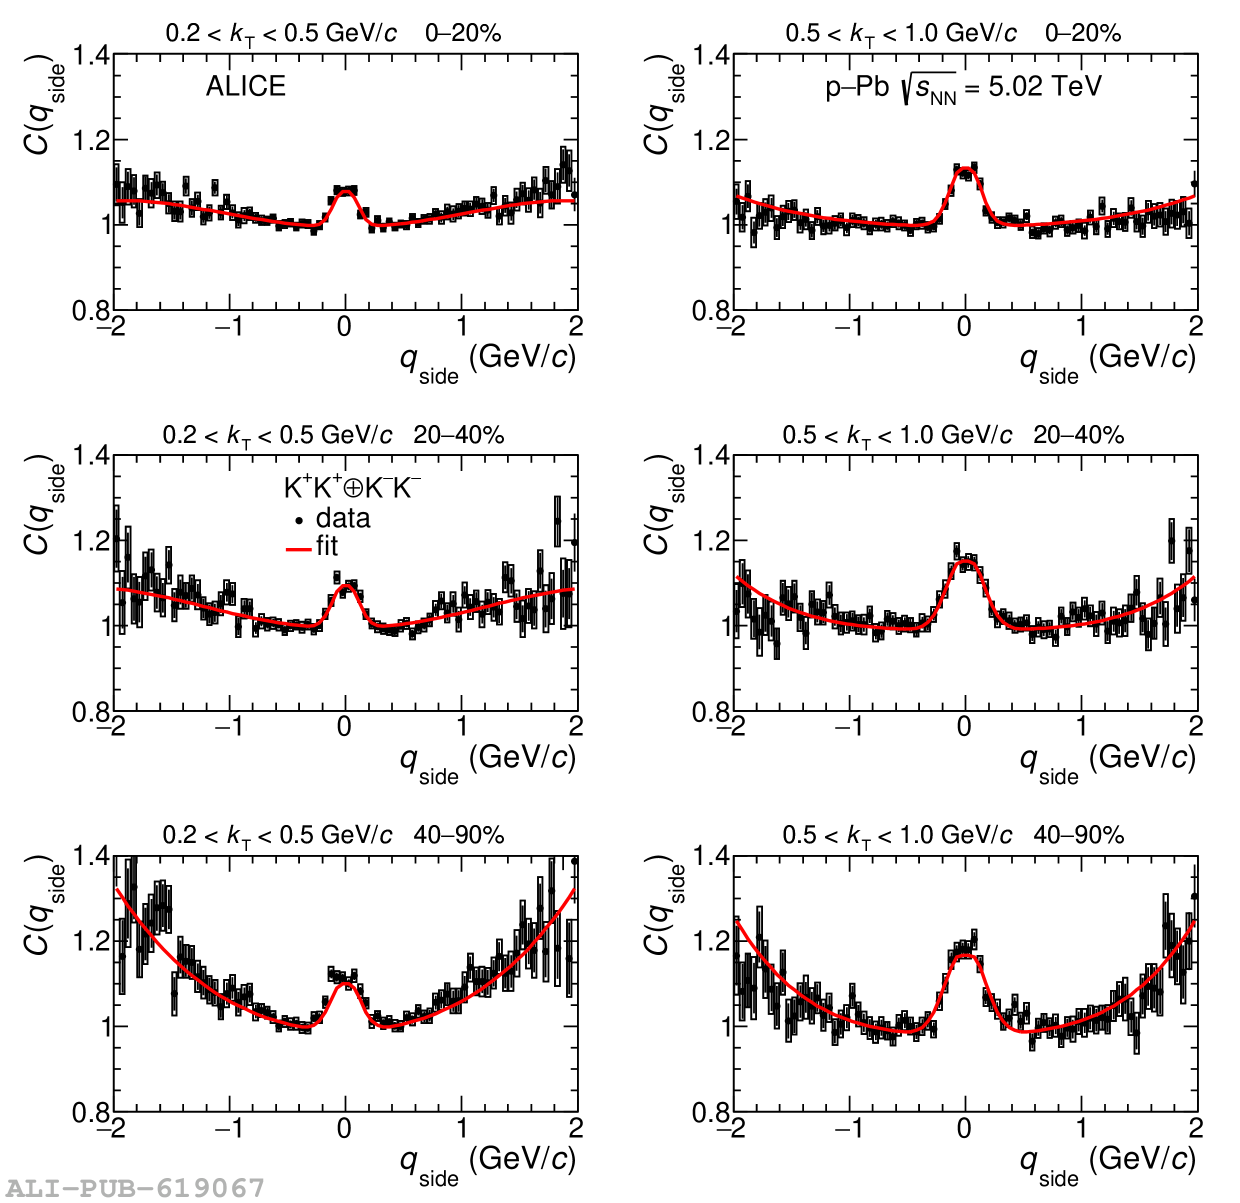 |
Figure 4
Projection of the 3D CF in the ${\rm long}$ direction (black full circles) in three multiplicity classes and two $k_{\rm T}$ ranges fitted (red solid lines) with Eq. (5). Statistical (systematic) uncertainties are shown by bars (boxes). The data are integrated over the range of $|q_i|< 0.15$ GeV$/c$ in the non-projected coordinates. Vertical lines not belonging to any marker at $|q_{\rm long}|\gtrapprox1.0$ GeV$/c$ are very-large error bars of data points that are out of the chosen $Y$ axis range. | 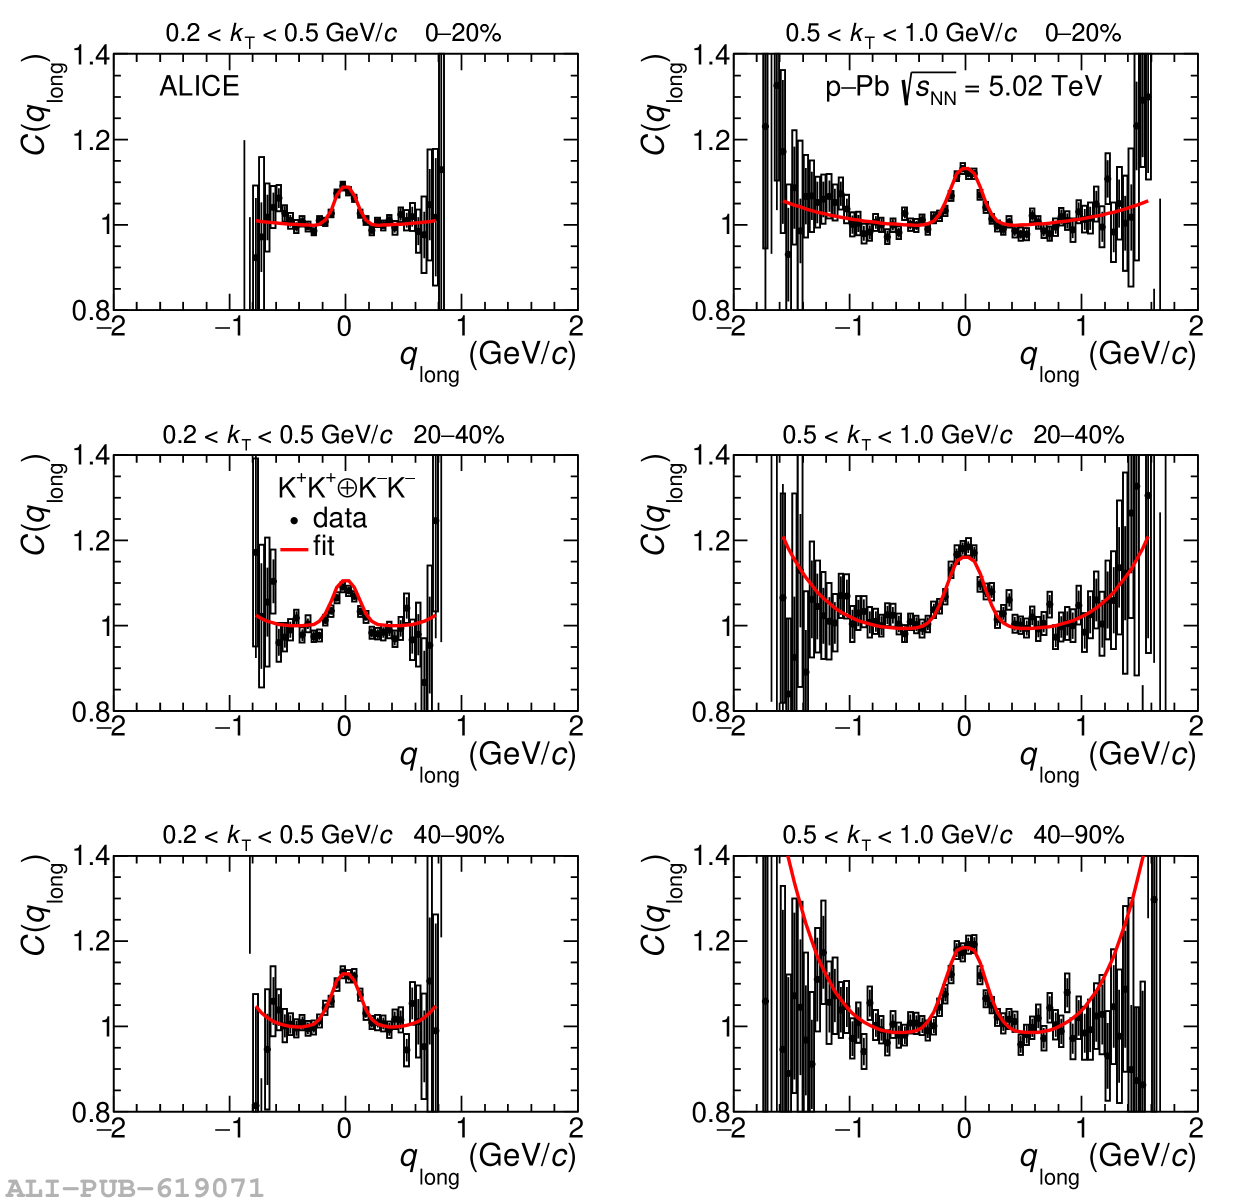 |
Figure 5
Experimental (symbols) K$^\pm$K$^\pm$ invariant radii $R_\mathrm{inv}$ (left) and correlation strengths $\lambda$ (right) shown as a function of the pair transverse momentum $k_{\mathrm T}$ for six multiplicity classes and compared with the EPOS 3 model predictions. The width of the bands represents the statistical uncertainty of the EPOS 3 predictions. The different colors of the bands correspond to the respective centralities as given by the ALICE data. Statistical (lines) and systematic uncertainties (boxes) are shown for the data points. The points for lower multiplicity classes are slightly shifted with respect to the 0$-$5% multiplicity class (black symbols) in the $x$ direction for clarity. | 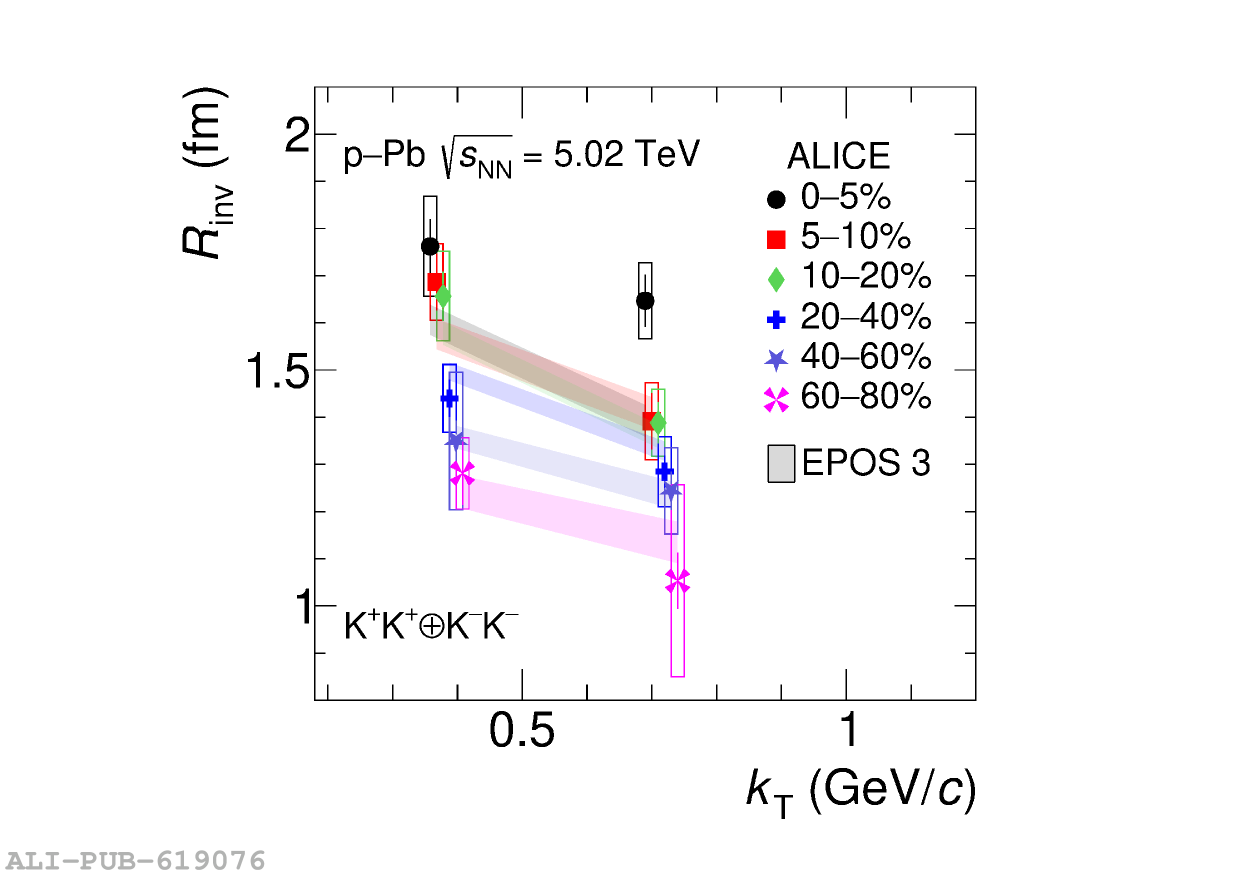 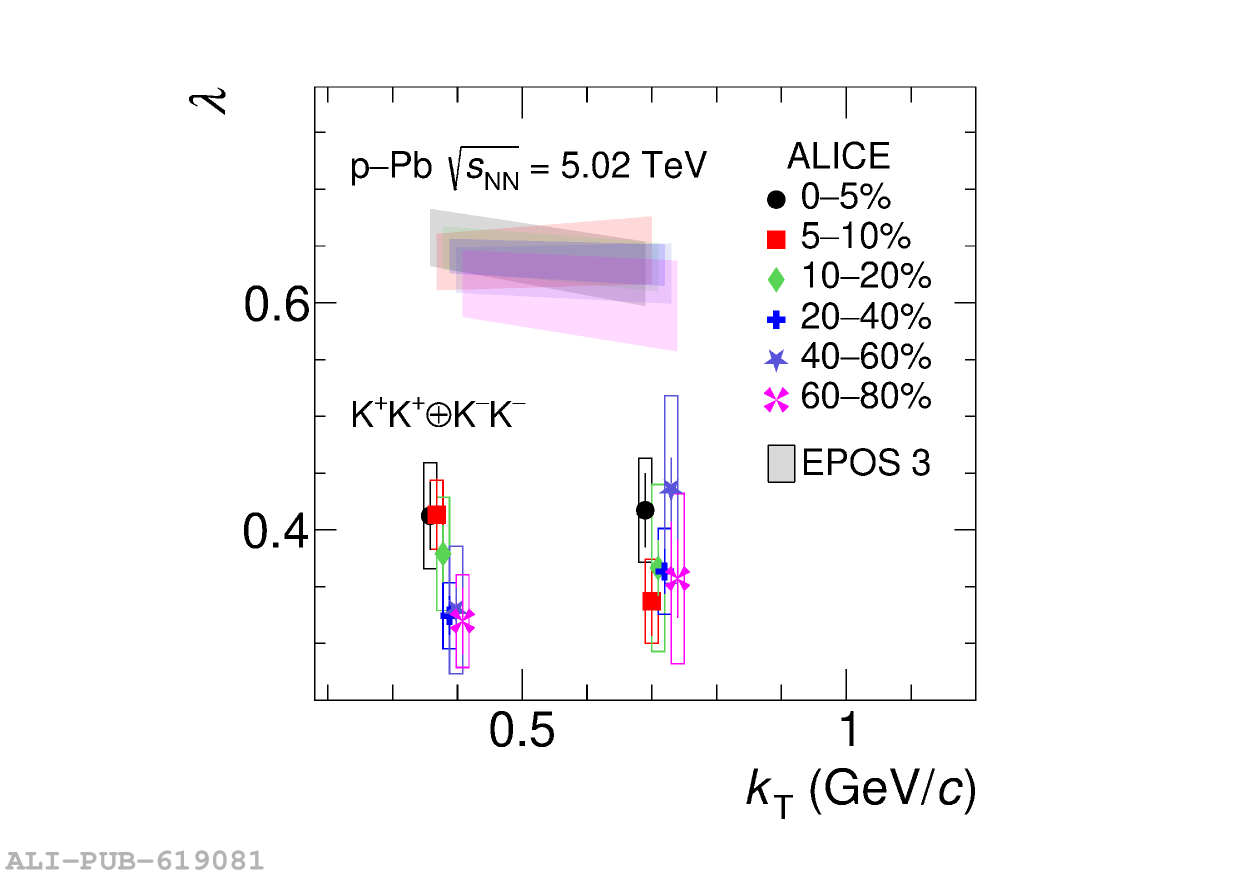 |
Figure 6
Experimental (symbols) K$^\pm$K$^\pm$ invariant radii $R_\mathrm{inv}$ (left) and correlation strengths $\lambda$ (right) shown as a function of the pair transverse momentum $k_{\mathrm T}$ for three multiplicity classes and compared with the EPOS 3 model predictions. The width of the bands represents the statistical uncertainty of the model calculations The different colors of the bands correspond to the respective centralities as given by the ALICE data Statistical (lines) and systematic uncertainties (boxes) are shown for the data points. The points for lower multiplicity classes are slightly shifted with respect to the 0$-$20% multiplicity class (black symbols) in the $x$ direction for clarity. | 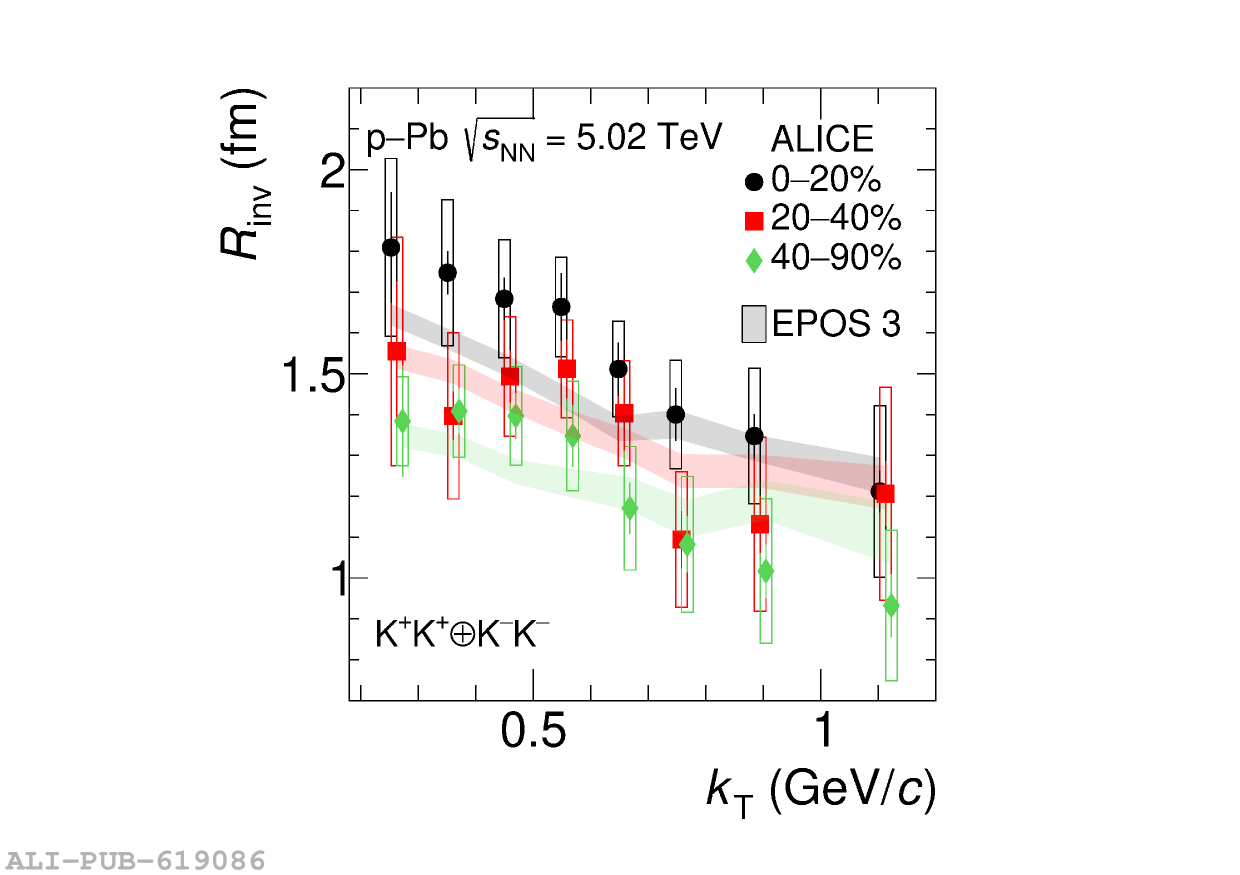 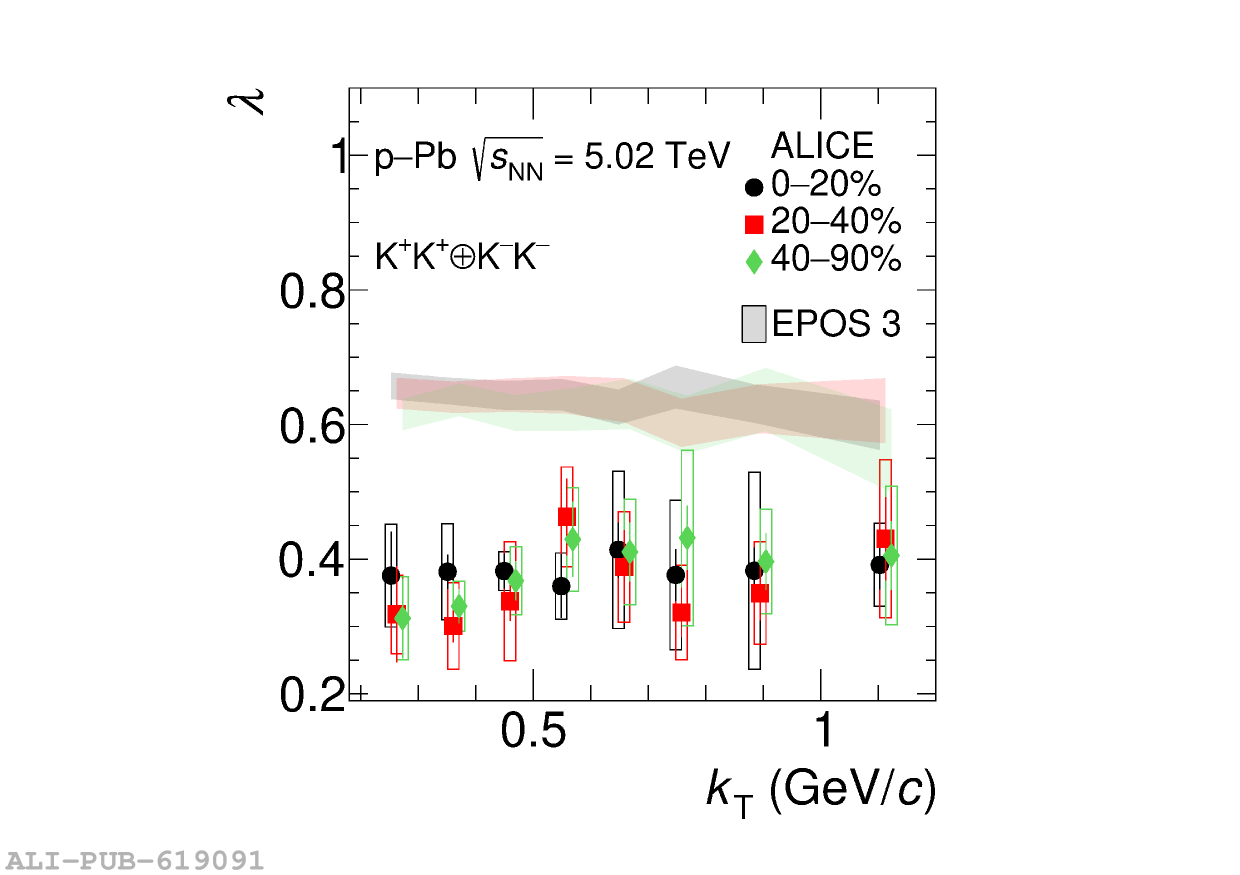 |
Figure 7
Femtoscopic radii extracted in the present analysis (green solid circles), as a function of the cube root of the measured charged-particle multiplicity $\langle N_{\rm ch}\rangle^{1/3}$, at low (left) and high (right) $k_{\rm T}$ compared with published results from pp (red solid squares), p$-$Pb (green empty circles), and Pb$-$Pb (blue diamonds) collisions. Statistical (lines) and systematic uncertainties (boxes) are shown. The dotted (dashed) line shows the fit of the pp and p$-$Pb (Pb$-$Pb) data with a first-order polynomial. | 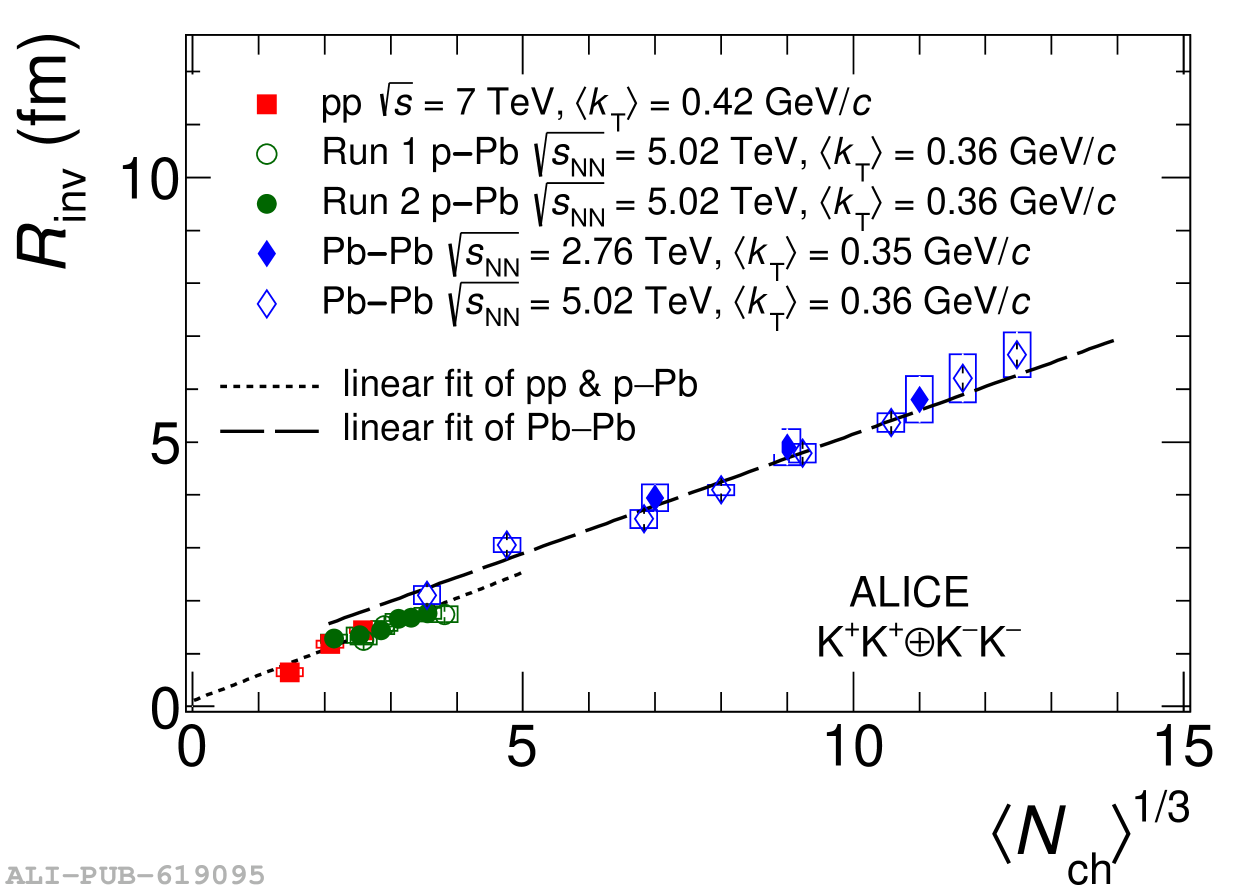 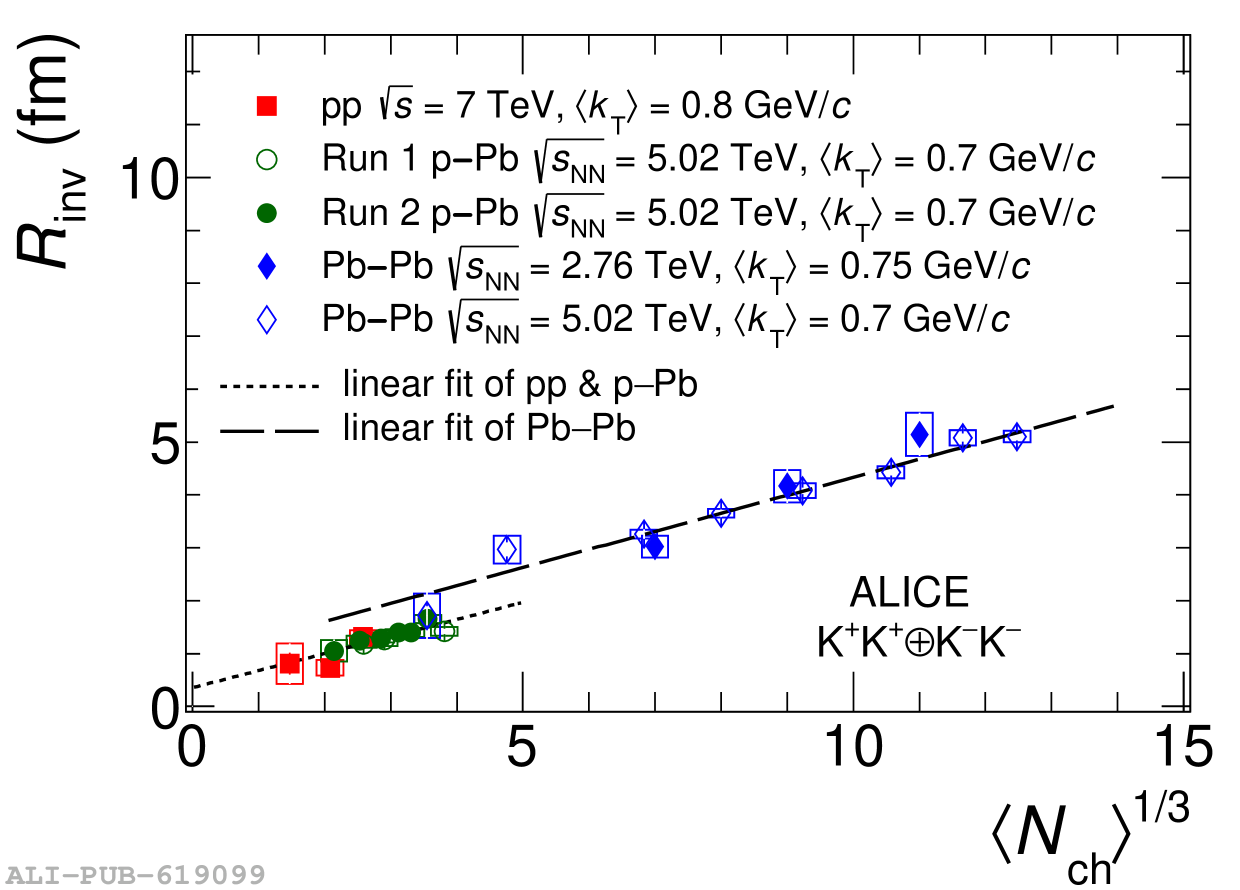 |
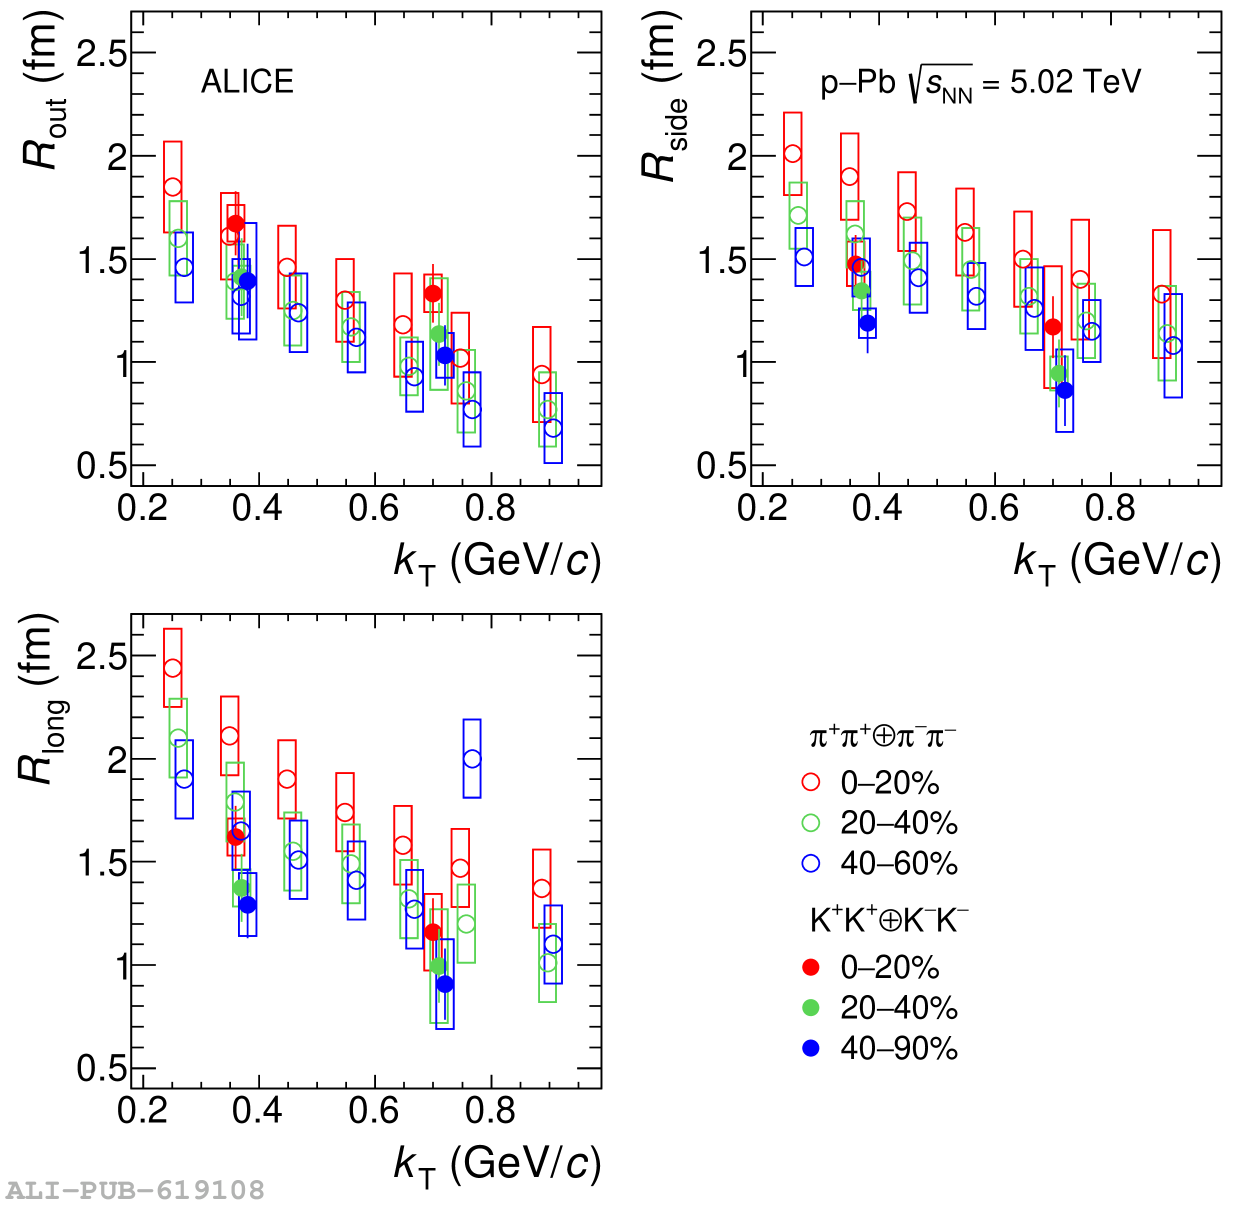
Figure 8
3D $R$ and $\lambda$ parameters as a function of $k_{\rm T}$ in three multiplicity and two $k_{\rm T}$ classes. The experimental data (markers) are compared with the EPOS 3 model predictions shown by bands, the width of which represents the statistical uncertainty on the model calculations. Statistical (bars) and systematic (rectangles) uncertainties are shown. Points are shifted with respect to the 0$-$20% multiplicity class along the $x$ axis for clarity. | 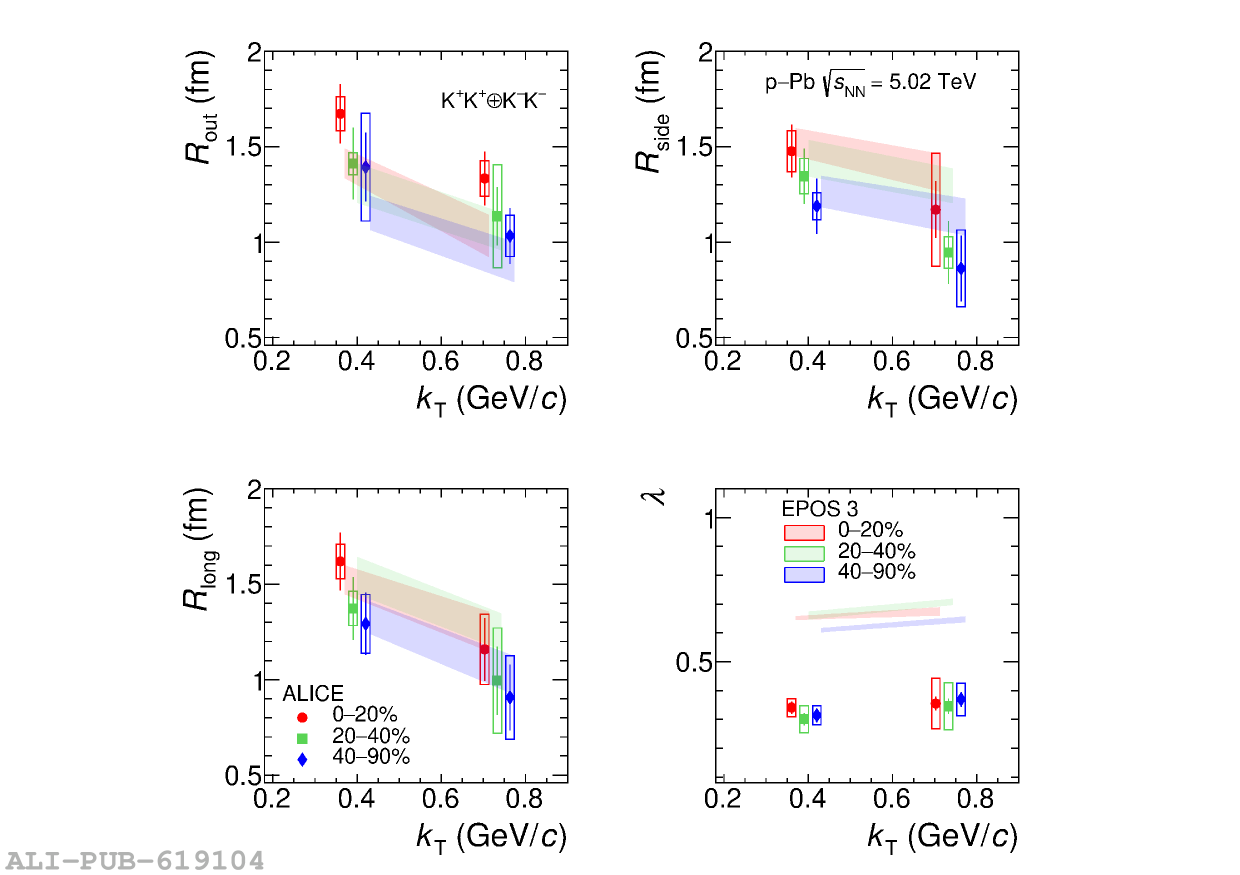 |